

Newsroom
Sorted by: Latest
-
Liquid Networx Wins Two Partner of the Year Awards at Fortinet Accelerate 2026
SAN ANTONIO--(BUSINESS WIRE)--Liquid Networx, an expert cybersecurity and managed services provider, announced today that it was named Fortinet’s first Engage Preferred Services Partner (EPSP) Partner of the Year in North America and Unified SASE Partner of the Year for the third year in a row. Liquid is the first partner to be awarded two designations in one year. The Fortinet Partner of the Year Awards recognize dedicated and distinguished partners and distributors around the world. Fortinet’...
-
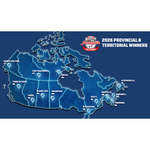
Kraft Hockeyville Unveils 13 Provincial & Territorial Winners in 20th Anniversary Year
TORONTO--(BUSINESS WIRE)--In a defining moment for community hockey in Canada, Kraft Heinz, in partnership with the National Hockey League (NHL®) and the National Hockey League Players’ Association (NHLPA), today announced the very first 13 Provincial & Territorial Winners of Kraft Hockeyville 2026—a historic milestone that extends the program’s impact from coast to coast to coast. Marking the program’s landmark 20th year, this new phase expands the contest format to ensure representation f...
-
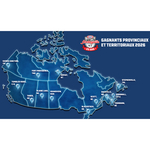
Kraft Hockeyville dévoile les 13 gagnants provinciaux et territoriaux pour son 20e anniversaire
TORONTO--(BUSINESS WIRE)--Dans un moment marquant pour le hockey communautaire au Canada, Kraft Heinz, en partenariat avec la Ligue nationale de hockey (LNH®) et l’Association des joueurs de la Ligue nationale de hockey (AJLNH), a annoncé aujourd’hui les tout premiers 13 provinciaux et territoriaux de Kraft Hockeyville 2026, une étape historique qui étend l’impact du programme d’un océan à l’autre. À l’occasion de la 20e année marquante du programme, cette nouvelle phase élargit le format du co...
-
HRZN Investors Have Opportunity to Join Horizon Technology Finance Corporation Fraud Investigation with the Schall Law Firm
LOS ANGELES--(BUSINESS WIRE)--HRZN Investors Have Opportunity to Join Horizon Technology Finance Corporation Fraud Investigation with the Schall Law Firm...
-
IRON Investors Have Opportunity to Join Disc Medicine, Inc. Fraud Investigation with the Schall Law Firm
LOS ANGELES--(BUSINESS WIRE)--IRON Investors Have Opportunity to Join Disc Medicine, Inc. Fraud Investigation with the Schall Law Firm...
-
VAC Investors Have Opportunity to Join Marriott Vacations Worldwide Corporation Fraud Investigation with the Schall Law Firm
LOS ANGELES--(BUSINESS WIRE)--VAC Investors Have Opportunity to Join Marriott Vacations Worldwide Corporation Fraud Investigation with the Schall Law Firm...
-
PLNT Investors Have Opportunity to Join Planet Fitness, Inc. Fraud Investigation with the Schall Law Firm
LOS ANGELES--(BUSINESS WIRE)--PLNT Investors Have Opportunity to Join Planet Fitness, Inc. Fraud Investigation with the Schall Law Firm...
-
NAK Investors Have Opportunity to Join Northern Dynasty Minerals Ltd. Fraud Investigation with the Schall Law Firm
LOS ANGELES--(BUSINESS WIRE)--NAK Investors Have Opportunity to Join Northern Dynasty Minerals Ltd. Fraud Investigation with the Schall Law Firm...
-
HTGC Investors Have Opportunity to Join Hercules Capital, Inc. Fraud Investigation with the Schall Law Firm
LOS ANGELES--(BUSINESS WIRE)--HTGC Investors Have Opportunity to Join Hercules Capital, Inc. Fraud Investigation with the Schall Law Firm...
-
Changan Global Testing Season 2026 chega ao México com quatro novos modelos
CIDADE DO MÉXICO--(BUSINESS WIRE)--A Changan lançou no México quatro novos modelos atualizados — o sedã CHANGAN ALSVIN PLUS e três SUVs: CS35 MAX, CS55 PLUS e CS75 PLUS — atendendo à crescente demanda do mercado por veículos que integrem tecnologia e eficiência. Após o lançamento, mais de 150 concessionários, investidores e representantes da imprensa participaram de um test drive de 287 km pela Península de Yucatán, como parte da Changan Global Testing Season 2026. O trajeto, de Cancún a Playa...