

Trade Disruption Drives 2,400% Surge in Shipping Reroutes, ePost Global Data Shows
Trade Disruption Drives 2,400% Surge in Shipping Reroutes, ePost Global Data Shows
Analysis of 23.3 million shipments highlights sustained volatility across global logistics networks
CYPRESS, Calif.--(BUSINESS WIRE)--A wave of tariff changes, tightening customs enforcement, carrier capacity constraints, and postal disruptions last year set off a chain reaction across global shipping that didn’t ease as the year went on – and shows no signs of slowing.
ePost Global's Shipping Intelligence Report shows that rerouting activity across international shipments climbed more than 2,400% from early 2025 through December.
Share
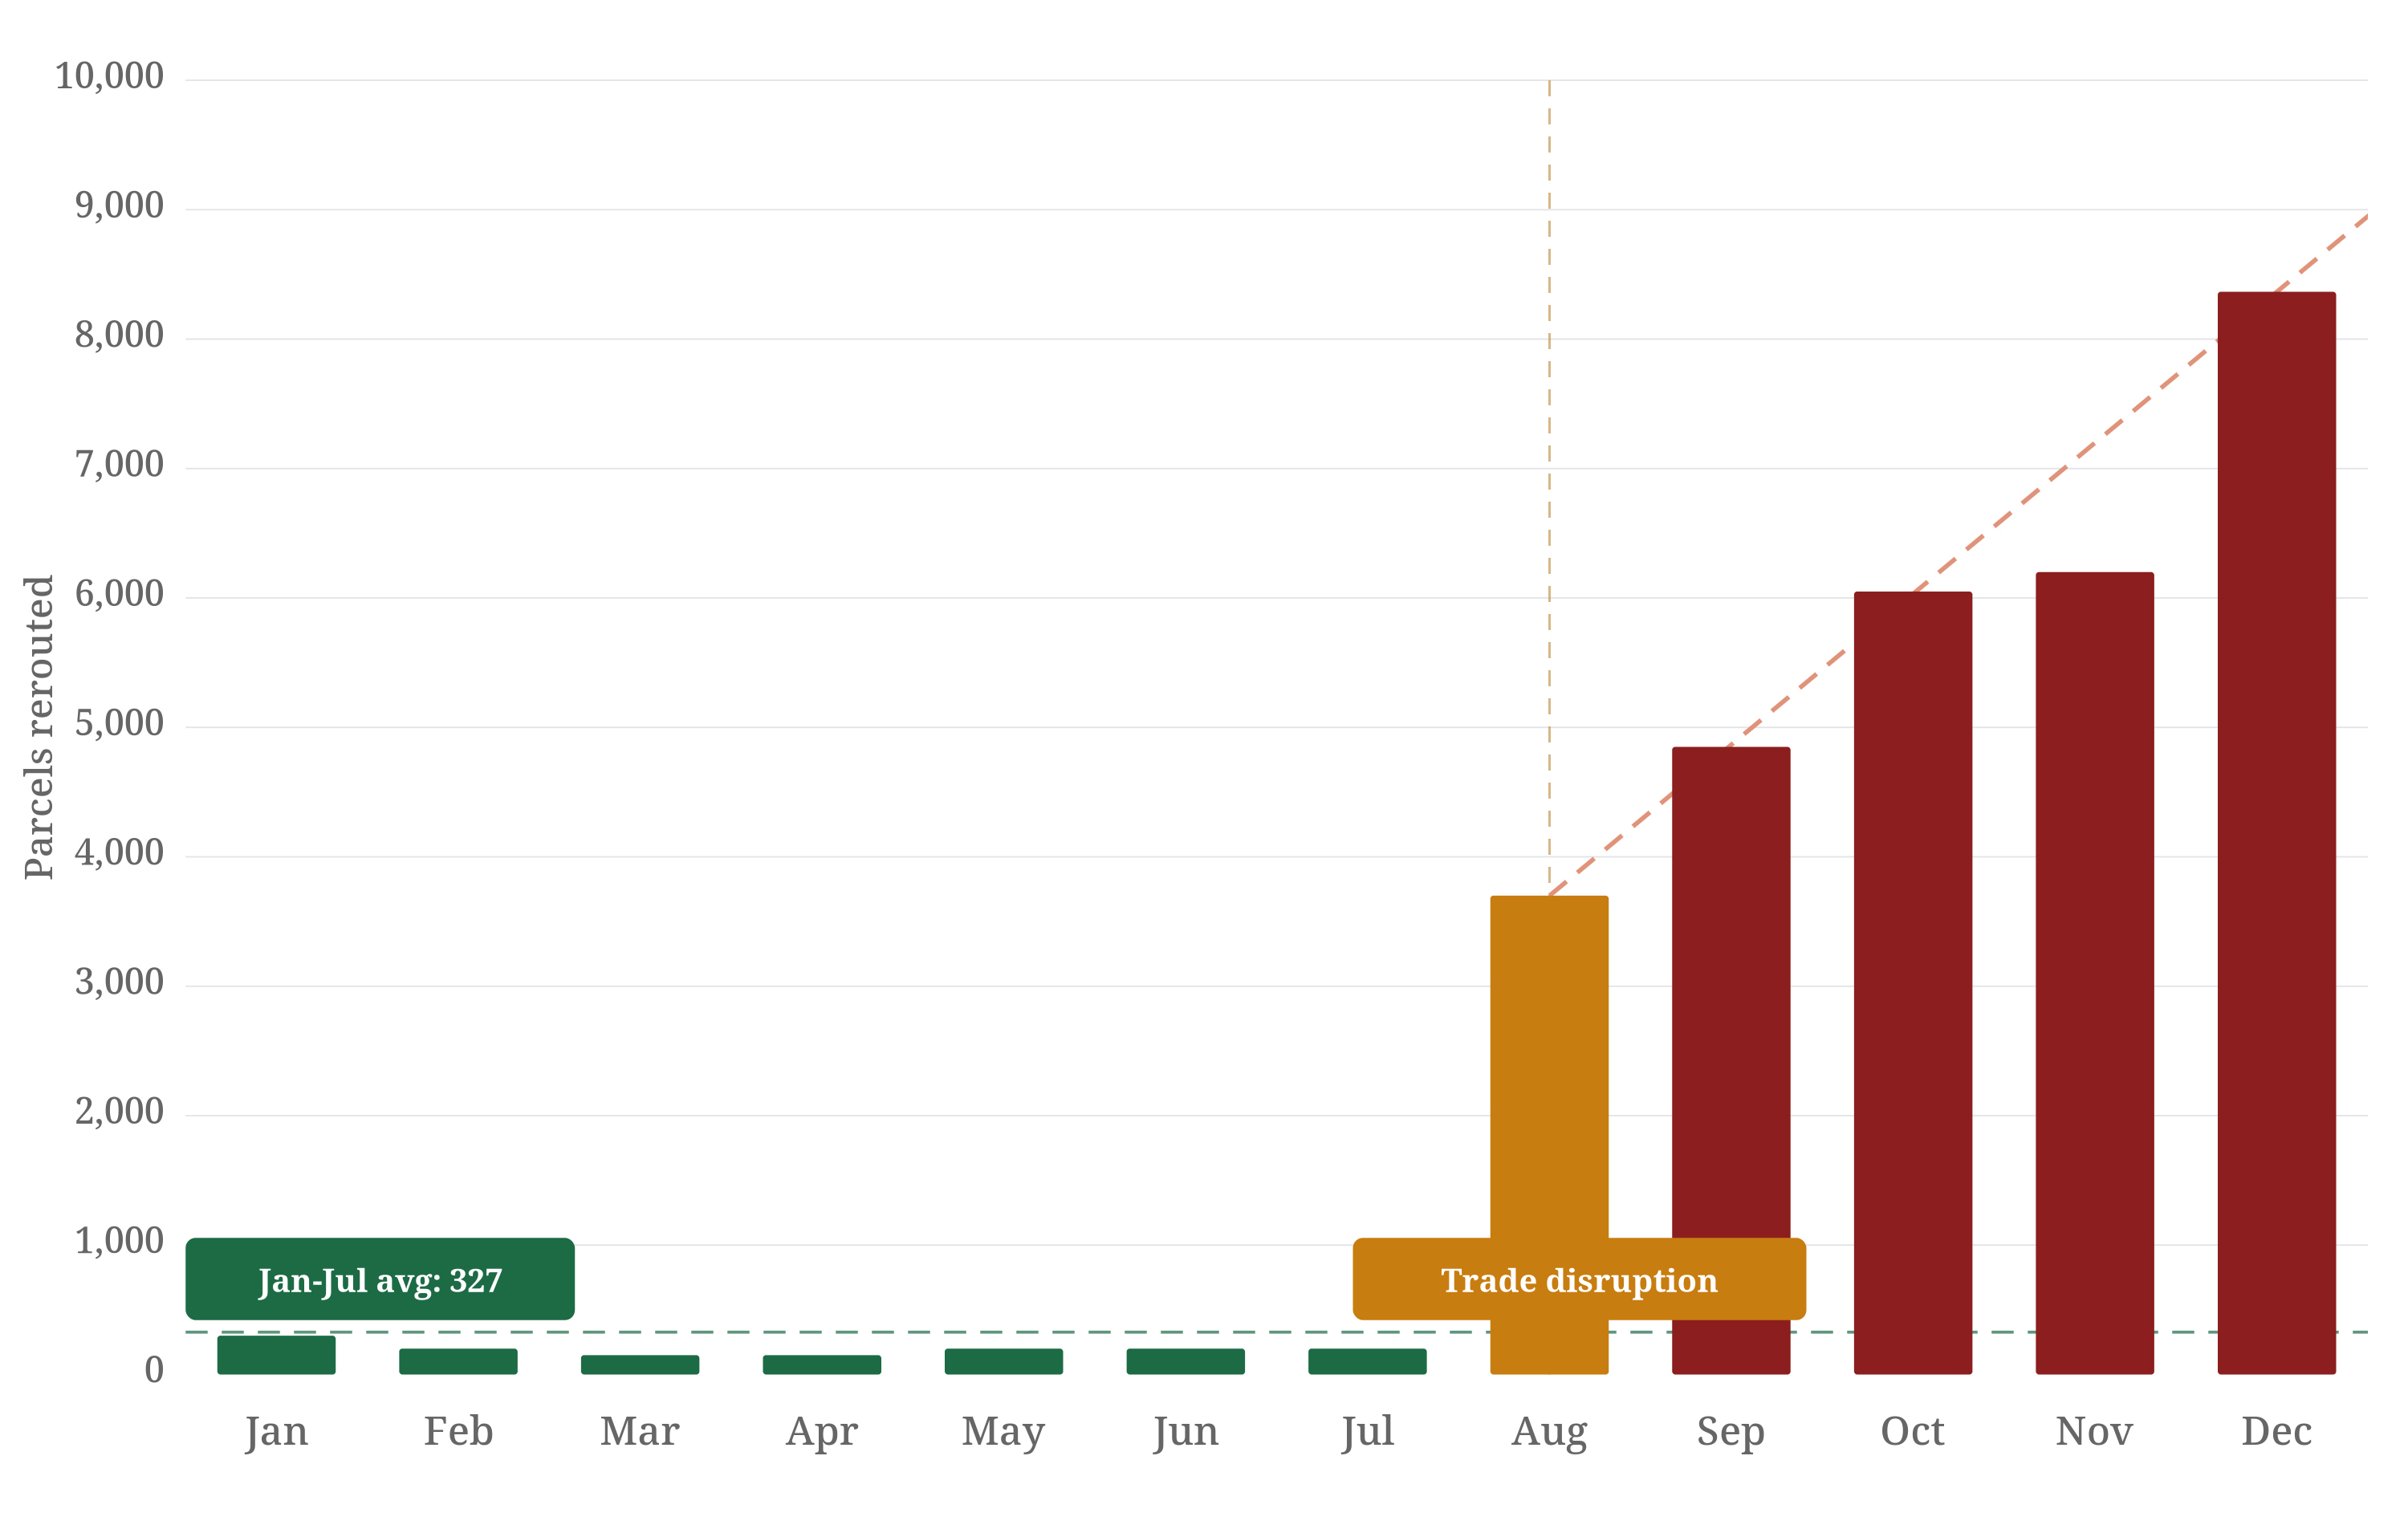
New data released today from ePost Global shows that rerouting activity across international shipments climbed more than 2,400% from early 2025 through December, as brands adjusted to rising costs, shifting carrier capacity, and changing customs requirements in real time. The company’s latest annual Shipping Intelligence Report is based on 23.3 million shipments in 2025 across more than 100 carrier partners, offering a detailed view into how those pressures played out across markets and shipping lanes.
Rerouted parcels averaged 327 per month from January through July. In August, that number rose sharply to 3,767 shipments, as these combined pressures – including tariff shifts, stricter customs enforcement, the Canada Union Postal Workers (CUPW) and Canada Post labor situation, and changes tied to de minimis thresholds – forced companies to quickly rethink how goods moved across borders. Instead of returning to earlier levels, rerouting continued to climb each month, reaching 8,366 in December. The increase was not a one-time spike. Rerouting activity continued to accelerate through peak season, with no return to earlier baseline levels.
“What’s different from other years is there was usually a reset, but conditions didn’t stabilize after the initial disruption,” said Kelly Martinez, Co-Founder and Co-President of ePost Global. “Policy kept shifting, capacity stayed tight, and the bar for delivery didn’t come down. Once that happened, there wasn’t really room to step back.”
The data also shows how uneven carrier performance became under those conditions. ePost Global observed a 96-point gap between top-performing and underperforming carriers, creating risk for companies heavily reliant on a single provider. In many cases, companies with diversified carrier networks were able to shift as much as 30% of shipment volume within 48 hours in response to disruptions, while others had fewer options when service levels dropped.
Customs handling proved equally decisive. In higher-risk markets, shipments using Delivered Duty Paid (DDP) models – where duties and documentation are handled before shipping – were more than 30 times as likely to successfully clear and deliver compared to unpaid models. In many cases, this had a greater impact on delivery outcomes than carrier selection alone.
Product categories added another dimension of risk. Electronics ($51.5M in shipped value), luxury goods ($70.1M), and food and beverage ($16.1M) collectively represent nearly one-third of cross-border value analyzed, while consuming a disproportionate share of customs resources and compliance costs. As enforcement tightened, these categories required more precise classification and documentation – specifically HS codes, declared values, and country of origin – to avoid delays and unexpected costs.
Geographic performance gaps were also pronounced. The UK, Canada, and Australia consistently showed stronger delivery outcomes due to more reliable infrastructure – a reminder that market size alone should not drive international expansion decisions. Performance data must come first.
Taken together, the data points to a shift in how companies are approaching cross-border shipping. Rerouting at the levels seen late in the year is no longer treated as an exception. Many teams are planning around these conditions as part of normal operations, rather than waiting for disruption levels to drop.
The full 2025 Shipping Intelligence Report with strategic recommendations is available at: https://epostglobalshipping.com/2025-international-shipping-insights-trends-report
Methodology
The report analyzes proprietary shipment data from ePost Global’s global network, covering 23.3 million items shipped across 200+ countries in 2025. The dataset reflects actual shipment activity across carriers, destinations, shipping methods, and product categories.
All data is aggregated to protect customer confidentiality and includes performance insights related to rerouting activity, carrier performance, and customs processing outcomes.
About ePost Global
ePost Global is the resilience layer between brands, platforms, and international shipping chaos. With more than 22 years of experience and 30+ years of international logistics expertise per team member, ePost Global helps businesses absorb carrier failures, customs complexity, and regulatory change so global delivery remains predictable.
Through intelligent multi-carrier orchestration across 200+ countries and territories, ePost Global turns cross-border shipping into a controlled, reliable growth lever. Global shipping. Zero surprises. Learn more at epostglobalshipping.com
Contacts
Media Contact
Mel Rubbelke
epost@gregoryagency.com