US Telecom Service Provider Reduces Turnaround Time by 24% With the Help of Interactive Data Visualization
US Telecom Service Provider Reduces Turnaround Time by 24% With the Help of Interactive Data Visualization
Get in touch with Quantzig for similar engagements
LONDON--(BUSINESS WIRE)--Quantzig, a global data analytics and advisory firm that delivers actionable analytics solutions to resolve complex business problems has announced the completion of its recent engagement that sheds light on the importance of interactive data visualization.
The case study aligns perfectly with Quantzig’s commitment to helping its clients leverage interactive data visualization to improve decision-making using data-driven, real-time insights.
With the rise of big data analytics, the importance of interactive data visualization is growing at a very high pace. To remain competitive in the future and incorporate interactive data visualization in your business request a FREE proposal today.
Interactive data visualization is the representation of big data or any information in a graphical format. It enables businesses to grasp difficult concepts and identify new patterns in data within a very short span of time. With big data analytics around there are ample opportunities to drive business outcomes, but many businesses are challenged when it comes to finding value in their big data analytics investments. Interactive data visualization can be of great help in such a situation.
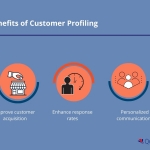
The US telecom industry is the backbone of the US economy. A huge amount of data passes through the telecom networks every day. With numerous customers and their need for personalized services along with frequent entry of competitors, the US telecom industry faces challenges in operational support services such as order fulfillment and billing.
Due to its ability to rapidly comprehend data that is in a visual form, interactive data visualization can increase the speed of decision-making. Speak to our big data analytics experts for personalized recommendations.
Key Questions Answered
- Why is interactive data visualization important for enabling businesses to access data easily?
- How an interactive data visualization dashboard can help your organization to speed up decision-making processes?
- How can players in the US telecom industry benefit from interactive data visualization?
According to Quantzig’s interactive data visualization experts, “One of the most significant advantages of data visualization is that it allows us to analyze huge volumes of data at the literal glimpse of an eye.”
One of the most transformative features of interactive data visualization is that unlike conventional methods of data visualization such as spreadsheets, it allows businesses to dive deeper and transform data into many different types of visualizations. Book a FREE Demo for comprehensive insights.
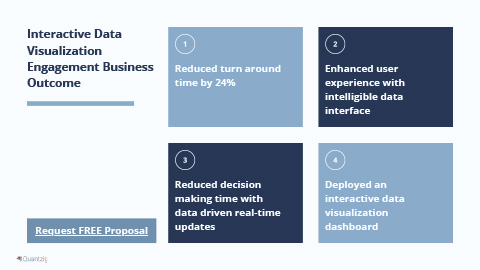
How Interactive Data Visualization Helped the US Telecom Services Provider
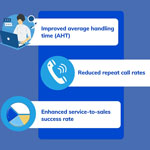
- Reduced turnaround time by 24%
- Enhanced user experience with an intelligible data interface
- Improved decision-making process with data-driven, real-time updates
- Deployed an interactive data visualization dashboard
Quantzig’s scenario planning model helped the client identify the emerging trends and potential disruptions that are most likely to affect their business. Read the complete success story for comprehensive insights: https://bit.ly/3gxLBXm
About Quantzig
Quantzig is a global analytics and advisory firm with offices in the US, UK, Canada, China, and India. For more than 15 years, we have assisted our clients across the globe with end-to-end data modeling capabilities to leverage analytics for prudent decision making. Today, our firm consists of 120+ clients, including 45 Fortune 500 companies. For more information on our engagement policies and pricing plans, visit: https://www.quantzig.com/request-for-proposal
Contacts
Quantzig
Anirban Choudhury
Marketing Manager
US: +1 630 538 7144
UK: +44 208 629 1455
https://www.quantzig.com/contact-us