Schwab Reports Monthly Activity Highlights
Schwab Reports Monthly Activity Highlights
SAN FRANCISCO--(BUSINESS WIRE)--The Charles Schwab Corporation released its Monthly Activity Report today. Company highlights for the month of January 2020 include:
- Core net new assets brought to the company by new and existing clients totaled $20.9 billion. Net new assets excluding mutual fund clearing totaled $19.4 billion.
- Total client assets were $4.05 trillion as of month-end January, up 18% from January 2019 and flat compared to December 2019.
- New brokerage accounts were 167,000 in January, up 27% from January 2019 and up 2% compared to December 2019, representing the highest January on record for new accounts.
About Charles Schwab
The Charles Schwab Corporation (NYSE: SCHW) is a leading provider of financial services, with more than 360 offices and 12.4 million active brokerage accounts, 1.7 million corporate retirement plan participants, 1.4 million banking accounts, and $4.05 trillion in client assets as of January 31, 2020. Through its operating subsidiaries, the company provides a full range of wealth management, securities brokerage, banking, asset management, custody, and financial advisory services to individual investors and independent investment advisors. Its broker-dealer subsidiary, Charles Schwab & Co., Inc. (member SIPC, https://www.sipc.org), and affiliates offer a complete range of investment services and products including an extensive selection of mutual funds; financial planning and investment advice; retirement plan and equity compensation plan services; referrals to independent, fee-based investment advisors; and custodial, operational and trading support for independent, fee-based investment advisors through Schwab Advisor Services. Its banking subsidiary, Charles Schwab Bank (member FDIC and an Equal Housing Lender), provides banking and lending services and products. More information is available at https://www.schwab.com and https://www.aboutschwab.com.
| The Charles Schwab Corporation Monthly Activity Report For January 2020 | |||||||||||||||||||||||||||||||||||||||||||||
2019 |
2020 |
Change | |||||||||||||||||||||||||||||||||||||||||||
| Jan | Feb | Mar | Apr | May | Jun | Jul | Aug | Sep | Oct | Nov | Dec | Jan | Mo. | Yr. | |||||||||||||||||||||||||||||||
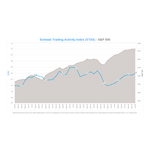
| Market Indices (at month end) | |||||||||||||||||||||||||||||||||||||||||||||
| Dow Jones Industrial Average | 25,000 |
|
25,916 |
|
25,929 |
|
26,593 |
|
24,815 |
|
26,600 |
|
26,864 |
|
26,403 |
|
26,917 |
|
27,046 |
|
28,051 |
|
28,538 |
|
28,256 |
|
(1%) |
|
13% |
||||||||||||||||
| Nasdaq Composite | 7,282 |
|
7,533 |
|
7,729 |
|
8,095 |
|
7,453 |
|
8,006 |
|
8,175 |
|
7,963 |
|
7,999 |
|
8,292 |
|
8,665 |
|
8,973 |
|
9,151 |
|
2% |
|
26% |
||||||||||||||||
| Standard & Poor’s 500 | 2,704 |
|
2,784 |
|
2,834 |
|
2,946 |
|
2,752 |
|
2,942 |
|
2,980 |
|
2,926 |
|
2,977 |
|
3,038 |
|
3,141 |
|
3,231 |
|
3,226 |
|
- |
|
19% |
||||||||||||||||
| Client Assets (in billions of dollars) |
|
|
|
||||||||||||||||||||||||||||||||||||||||||
| Beginning Client Assets | 3,252.2 |
|
3,447.7 |
|
3,533.0 |
|
3,585.4 |
|
3,668.5 |
|
3,530.6 |
|
3,702.4 |
|
3,746.7 |
|
3,716.5 |
|
3,768.4 |
|
3,854.6 |
|
3,942.2 |
|
4,038.8 |
|
|
|
|
||||||||||||||||
| Net New Assets (1) | 15.1 |
|
18.3 |
|
18.3 |
|
(0.3 |
) |
17.3 |
|
20.2 |
|
19.3 |
|
19.9 |
|
17.4 |
|
35.2 |
|
12.0 |
|
30.1 |
|
20.9 |
|
(31%) |
|
38% |
||||||||||||||||
| Net Market Gains (Losses) | 180.4 |
|
67.0 |
|
34.1 |
|
83.4 |
|
(155.2 |
) |
151.6 |
|
25.0 |
|
(50.1 |
) |
34.5 |
|
51.0 |
|
75.6 |
|
66.5 |
|
(8.1 |
) |
|
|
|
||||||||||||||||
| Total Client Assets (at month end) | 3,447.7 |
|
3,533.0 |
|
3,585.4 |
|
3,668.5 |
|
3,530.6 |
|
3,702.4 |
|
3,746.7 |
|
3,716.5 |
|
3,768.4 |
|
3,854.6 |
|
3,942.2 |
|
4,038.8 |
|
4,051.6 |
|
- |
|
18% |
||||||||||||||||
| Core Net New Assets (2) | 15.1 |
|
18.3 |
|
18.3 |
|
(0.3 |
) |
17.3 |
|
20.2 |
|
19.3 |
|
19.9 |
|
17.4 |
|
24.1 |
|
12.0 |
|
30.1 |
|
20.9 |
|
(31%) |
|
38% |
||||||||||||||||
| Receiving Ongoing Advisory Services (at month end) |
|
|
|
||||||||||||||||||||||||||||||||||||||||||
| Investor Services | 286.9 |
|
294.2 |
|
298.4 |
|
305.7 |
|
298.5 |
|
311.6 |
|
314.8 |
|
314.2 |
|
318.5 |
|
324.6 |
|
330.8 |
|
337.1 |
|
336.8 |
|
- |
|
17% |
||||||||||||||||
| Advisor Services (3) | 1,514.2 |
|
1,551.6 |
|
1,572.8 |
|
1,608.0 |
|
1,554.6 |
|
1,626.6 |
|
1,646.1 |
|
1,635.7 |
|
1,659.4 |
|
1,691.6 |
|
1,728.2 |
|
1,769.7 |
|
1,773.2 |
|
- |
|
17% |
||||||||||||||||
| Client Accounts (at month end, in thousands) |
|
|
|
||||||||||||||||||||||||||||||||||||||||||
| Active Brokerage Accounts | 11,653 |
|
11,712 |
|
11,787 |
|
11,870 |
|
11,929 |
|
11,967 |
|
12,026 |
|
12,085 |
|
12,118 |
|
12,189 |
|
12,247 |
|
12,333 |
|
12,431 |
|
1% |
|
7% |
||||||||||||||||
| Banking Accounts (4) | 1,312 |
|
1,313 |
|
1,300 |
|
1,310 |
|
1,323 |
|
1,336 |
|
1,352 |
|
1,361 |
|
1,361 |
|
1,374 |
|
1,384 |
|
1,390 |
|
1,403 |
|
1% |
|
7% |
||||||||||||||||
| Corporate Retirement Plan Participants | 1,679 |
|
1,685 |
|
1,684 |
|
1,690 |
|
1,699 |
|
1,698 |
|
1,701 |
|
1,711 |
|
1,718 |
|
1,735 |
|
1,743 |
|
1,748 |
|
1,732 |
|
(1%) |
|
3% |
||||||||||||||||
| Client Activity |
|
|
|
||||||||||||||||||||||||||||||||||||||||||
| New Brokerage Accounts (in thousands) | 131 |
|
115 |
|
140 |
|
147 |
|
123 |
|
116 |
|
129 |
|
126 |
|
108 |
|
142 |
|
127 |
|
164 |
|
167 |
|
2% |
|
27% |
||||||||||||||||
| Inbound Calls (in thousands) | 1,924 |
|
1,742 |
|
1,882 |
|
1,966 |
|
1,671 |
|
1,595 |
|
1,773 |
|
1,759 |
|
1,570 |
|
1,771 |
|
1,605 |
|
1,884 |
|
1,947 |
|
3% |
|
1% |
||||||||||||||||
| Web Logins (in thousands) | 64,563 |
|
60,121 |
|
63,692 |
|
65,669 |
|
61,522 |
|
60,824 |
|
65,809 |
|
63,928 |
|
63,530 |
|
72,547 |
|
66,394 |
|
69,733 |
|
77,716 |
|
11% |
|
20% |
||||||||||||||||
| Client Cash as a Percentage of Client Assets (5) | 11.7% |
11.5% |
11.3% |
10.9% |
11.3% |
10.9% |
11.0% |
11.3% |
11.4% |
11.3% |
11.3% |
11.3% |
11.3% |
- |
|
(40) bp |
|||||||||||||||||||||||||||||
| Mutual Fund and Exchange-Traded Fund |
|
|
|
||||||||||||||||||||||||||||||||||||||||||
| Net Buys (Sells) (6, 7) (in millions of dollars) |
|
|
|
||||||||||||||||||||||||||||||||||||||||||
| Large Capitalization Stock | 1,343 |
|
1,109 |
|
1,045 |
|
980 |
|
1,114 |
|
206 |
|
717 |
|
328 |
|
23 |
|
900 |
|
1,406 |
|
991 |
|
845 |
|
|
|
|
||||||||||||||||
| Small / Mid Capitalization Stock | 1,329 |
|
638 |
|
302 |
|
136 |
|
(190 |
) |
18 |
|
10 |
|
(374 |
) |
(212 |
) |
(458 |
) |
73 |
|
201 |
|
(314 |
) |
|
|
|
||||||||||||||||
| International | 2,212 |
|
1,086 |
|
1,274 |
|
863 |
|
(100 |
) |
225 |
|
744 |
|
(1,390 |
) |
(355 |
) |
340 |
|
735 |
|
993 |
|
1,360 |
|
|
|
|
||||||||||||||||
| Specialized | 124 |
|
609 |
|
750 |
|
(109 |
) |
(440 |
) |
341 |
|
418 |
|
353 |
|
583 |
|
618 |
|
484 |
|
455 |
|
762 |
|
|
|
|
||||||||||||||||
| Hybrid | (321 |
) |
(309 |
) |
(357 |
) |
(228 |
) |
(316 |
) |
(181 |
) |
(366 |
) |
(569 |
) |
(372 |
) |
(202 |
) |
(290 |
) |
(96 |
) |
615 |
|
|
|
|
||||||||||||||||
| Taxable Bond | 3,956 |
|
2,871 |
|
1,923 |
|
3,029 |
|
1,821 |
|
2,378 |
|
3,806 |
|
2,725 |
|
2,935 |
|
2,813 |
|
2,274 |
|
4,710 |
|
5,714 |
|
|
|
|
||||||||||||||||
| Tax-Free Bond | 1,184 |
|
1,111 |
|
1,133 |
|
760 |
|
1,057 |
|
682 |
|
960 |
|
760 |
|
593 |
|
809 |
|
860 |
|
1,255 |
|
1,481 |
|
|
|
|
||||||||||||||||
| Net Buy (Sell) Activity (in millions of dollars) |
|
|
|
||||||||||||||||||||||||||||||||||||||||||
| Mutual Funds (6) | 6,740 |
|
2,312 |
|
1,850 |
|
1,860 |
|
86 |
|
7 |
|
2,151 |
|
(1,281 |
) |
(573 |
) |
(473 |
) |
(761 |
) |
1,097 |
|
2,684 |
|
|
|
|
||||||||||||||||
| Exchange-Traded Funds (7) | 3,087 |
|
4,803 |
|
4,220 |
|
3,571 |
|
2,860 |
|
3,662 |
|
4,138 |
|
3,114 |
|
3,768 |
|
5,293 |
|
6,303 |
|
7,412 |
|
7,779 |
|
|
|
|
||||||||||||||||
| Money Market Funds | 4,944 |
|
(1,577 |
) |
1,785 |
|
(2,097 |
) |
5,067 |
|
4,570 |
|
6,143 |
|
6,068 |
|
5,833 |
|
7,059 |
|
4,768 |
|
1,515 |
|
1,911 |
|
|
|
|
||||||||||||||||
| Average Interest-Earning Assets (8) |
|
|
|
||||||||||||||||||||||||||||||||||||||||||
| (in millions of dollars) | 277,068 |
|
270,718 |
|
272,727 |
|
270,308 |
|
263,718 |
|
262,759 |
|
263,993 |
|
265,005 |
|
266,430 |
|
266,089 |
|
268,254 |
|
274,911 |
|
279,437 |
|
2% |
|
1% |
||||||||||||||||
(1) |
October 2019 includes an inflow of $11.1 billion from a mutual fund clearing services client. | ||||||||||||||||||||||||||||||
(2) |
Net new assets before significant one-time inflows or outflows, such as acquisitions/divestitures or extraordinary flows (generally greater than $10 billion) relating to a specific client. These flows may span multiple reporting periods. | ||||||||||||||||||||||||||||||
(3) |
Excludes Retirement Business Services. | ||||||||||||||||||||||||||||||
(4) |
In March 2019, banking accounts were reduced by approximately 23,000 as a result of inactive account closures. | ||||||||||||||||||||||||||||||
(5) |
Schwab One®, certain cash equivalents, bank deposits and money market fund balances as a percentage of total client assets. | ||||||||||||||||||||||||||||||
(6) |
Represents the principal value of client mutual fund transactions handled by Schwab, including transactions in proprietary funds. Includes institutional funds available only to Investment Managers. Excludes money market fund transactions. | ||||||||||||||||||||||||||||||
(7) |
Represents the principal value of client ETF transactions handled by Schwab, including transactions in proprietary ETFs. | ||||||||||||||||||||||||||||||
(8) |
Represents average total interest-earning assets on the company's balance sheet. | ||||||||||||||||||||||||||||||
Contacts
MEDIA:
Mayura Hooper
Charles Schwab
Phone: 415-667-1525
INVESTORS/ANALYSTS:
Rich Fowler
Charles Schwab
Phone: 415-667-1841