

Newsroom
Sorted by: Latest
-
Neuer ZOLL Zenix-Monitor/Defibrillator erhält MDR-Zulassung
CHELMSFORD, Massachusetts--(BUSINESS WIRE)--ZOLL®, ein Unternehmen der Asahi Kasei Corporation, das medizinische Geräte und zugehörige Softwarelösungen herstellt, gab heute bekannt, dass Zenix®, der klinisch fortschrittlichste und benutzerfreundlichste professionelle Monitor/Defibrillator des Unternehmens, gemäß der Medizinprodukteverordnung 2017/745 der Europäischen Union (EU), allgemein als EU MDR bezeichnet, zugelassen ist. Der Zenix-Monitor/Defibrillator ist ein bahnbrechendes Gerät, das Ef...
-
uniQure N.V. (QURE) Investors: Kessler Topaz Meltzer & Check, LLP Announces That the Firm Has Filed a Securities Fraud Class Action Lawsuit Against uniQure N.V. and Encourages Investors to Contact the Firm
RADNOR, Pa.--(BUSINESS WIRE)--Kessler Topaz Meltzer & Check, LLP informs investors that the firm has filed a securities fraud class action lawsuit against uniQure N.V. (NASDAQ: QURE) (“uniQure” or the “Company”) on behalf of investors who purchased or acquired uniQure ordinary shares between September 24, 2025, and October 31, 2025, inclusive (the “Class Period”). This action, captioned Scocco v. uniQure N.V., et al., Case No. 1:26-cv-01124, was filed in the United States District Court for...
-
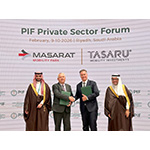
MASARAT Mobility Park与TASARU Supplier Hub达成合作协议,推动汽车制造本土化发展
沙特利雅得--(BUSINESS WIRE)--(美国商业资讯)-- 沙特阿拉伯汽车及移动出行产业的核心集聚地MASARAT Mobility Park与TASARU Supplier Hub签署开发租赁协议,后者是沙特公共投资基金(PIF)旗下公司TASARU Mobility Investments的战略布局项目。此次合作将为沙特汽车产业长期本土化发展筑牢基础,强化国家汽车供应链建设,同时大幅提升产业园对汽车整车厂(OEM)和供应商的价值吸引力。 这些协议于2026年第四届PIF私营部门论坛上正式公布。根据协议,TASARU Supplier Hub将在MASARAT Mobility Park打造生产制造基地,引入为OEM提供服务的全球一级汽车供应商,服务对象包括沙特首个本土电动汽车品牌Ceer以及Lucid Motors。该项目位于阿卜杜拉国王经济城(KAEC)特别经济区(SEZ)的萨勒曼国王汽车产业集群内,是沙特王国为实现“沙特2030愿景”而迈出的战略性一步,旨在加速构建世界一流的汽车及移动出行生态系统。 通过本次合作,MASARAT Mobility Park将打造一体化...

-
MASARAT Mobility Park與TASARU Supplier Hub達成合作協議,推動汽車製造本土化發展
沙烏地阿拉伯利雅德--(BUSINESS WIRE)--(美國商業資訊)-- 沙烏地阿拉伯汽車及行動運輸產業的核心集聚地MASARAT Mobility Park與TASARU Supplier Hub簽署開發租賃協議,後者是沙烏地阿拉伯公共投資基金(PIF)旗下公司TASARU Mobility Investments的一個策略性專案。此次合作將為沙烏地阿拉伯汽車產業長期本土化發展築牢基礎,強化國家汽車供應鏈建設,同時大幅提升產業園對汽車整車廠(OEM)和供應商的價值主張。 這些協議於2026年第四屆PIF私人部門論壇上公布。根據協議,TASARU Supplier Hub將在MASARAT Mobility Park打造生產製造基地,引進為OEM提供服務的全球一級汽車供應商,服務對象包括沙烏地阿拉伯第一個本土電動汽車品牌Ceer以及Lucid Motors。該專案位於阿卜杜拉國王經濟城(KAEC)特別經濟區(SEZ)的薩勒曼國王汽車產業群集內,是沙烏地阿拉伯王國為實現「沙烏地阿拉伯2030願景」而邁出的策略性一步,旨在加快建構世界一流的汽車及行動運輸生態系統。 透過本次合作,MAS...
-
ILiAD Biotechnologies kondigt een overtekende serie B-financiering van 115 miljoen dollar aan en zet de ontwikkeling van het BPZE1-kinkhoestvaccin voort
WESTON, Fla.--(BUSINESS WIRE)--ILiAD Biotechnologies, Inc. (ILiAD), een geavanceerd biotechnologisch bedrijf in de klinische fase dat zich richt op de preventie en behandeling van ziekten veroorzaakt door Bordetella pertussis, heeft vandaag bekendgemaakt dat het een overtekende serie B-financiering van 115 miljoen dollar succesvol heeft afgerond. De financiering werd geleid door RA Capital Management, met deelname van nieuwe investeerders Janus Henderson Investors en BNP Paribas Asset Managemen...
-
Kyndryl Holdings (KD) Shares Crater Amid Late Filing, Abrupt CFO and GC Departures, SEC Investigation – Hagens Berman
SAN FRANCISCO--(BUSINESS WIRE)--Kyndryl Holdings, Inc. (NYSE: KD) shares fell nearly 57% on Feb. 9, 2026, after the company announced it would not timely file its quarterly report for the quarter ended Dec. 31, 2025, and that its CFO, David Wyshner, and General Counsel, Edward Sebold, departed the company. These events prompted Hagens Berman, a national shareholder rights law firm, to investigate whether the company may have misled investors about assurances that its financial statements were p...
-
Cushman & Wakefield Hires Kevin Donner as Vice Chair in Los Angeles
LOS ANGELES--(BUSINESS WIRE)--Cushman & Wakefield announced that it has hired Kevin Donner as Vice Chair, based in the firm’s Los Angeles office....

-
Global Africa Investment Summit Launched in Dubai to Transform Africa’s Investment Landscape
DUBAI, United Arab Emirates--(BUSINESS WIRE)--The Global Africa Investment Summit launches to connect Africa’s sovereign assets with global capital and accelerate economic growth....

-
IEO en Laife Reply slaan de handen in elkaar om de biobank aan de hand van Artificiële Intelligentie te digitaliseren
TURIJN, Italië--(BUSINESS WIRE)--De Afdeling Pathologie van het Istituto Europeo di Oncologia (IEO) en Laife Reply, het bedrijf van de Reply Group gespecialiseerd in AI- en Big Data-oplossingen voor de sector van de gezondheidszorg, hebben een samenwerking gestart om Bianca te ontwikkelen, het eerste project in Italië bedoeld om een digitale biobank gebaseerd op AI te creëren, ontworpen als een integreel onderdeel van klinische diagnostische praktijken. Dit initiatief maakt deel uit van een rui...

-
ILiAD Biotechnologies gibt überzeichnete Serie-B-Finanzierung in Höhe von 115 Millionen US-Dollar zur Weiterentwicklung des BPZE1-Pertussis-Impfstoffs bekannt
WESTON, Florida--(BUSINESS WIRE)--ILiAD Biotechnologies, Inc. (ILiAD), ein Biotechnologieunternehmen im fortgeschrittenen klinischen Stadium, das sich auf die Prävention und Behandlung von durch Bordetella pertussis verursachten Erkrankungen konzentriert, gab heute den erfolgreichen Abschluss einer überzeichneten Serie-B-Finanzierung in Höhe von 115 Millionen US-Dollar bekannt. Die Finanzierung wurde von RA Capital Management angeführt, unter Beteiligung der neuen Investoren Janus Henderson Inv...