Newsroom
Sorted by: Latest
-
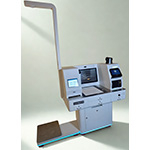
Zoya Technologies dévoile « ZoyeMed 3.0 » — une clinique autonome pilotée par l’IA, Edge-Native — au WHX Dubai
DUBAÏ, Émirats arabes unis--(BUSINESS WIRE)--Zoya Technologies a annoncé aujourd’hui le lancement de « ZoyeMed 3.0 », un kiosque/terminal clinique Edge-Native conçu pour fournir des soins primaires et aigus de manière autonome, tout en maintenant une supervision humaine. Le système a été présenté au WHX Dubai 2026. Il combine une IA embarquée (on-device), une détection multi-modale, des tests au point de soins (Point-of-Care), et une modélisation longitudinale du patient afin de soutenir des di...
-
Niagen Bioscience is the Premiere Sponsor of the Inaugural “NAD for Health: Opportunities & Challenges” Conference Hosted by the University of Copenhagen
LOS ANGELES--(BUSINESS WIRE)--Niagen Bioscience, Inc. (NASDAQ: NAGE), the global authority on NAD+ (nicotinamide adenine dinucleotide) with a focus on the science of healthy aging, today announces it is the headlining sponsor of the inaugural NAD for Health: Opportunities & Challenges scientific meeting hosted by the University of Copenhagen, taking place March 23–25, 2026 at the Royal Danish Academy of Sciences and Letters in central Copenhagen. Space is limited and registration is require...
-
BlackRock Announces Completion of Certain Municipal CEF Reorganizations and Adoption of Discount Management Program
NEW YORK--(BUSINESS WIRE)--BlackRock Advisors, LLC announced today each of the closed-end funds named below (each, a “Fund” and collectively, the “Funds”) have completed their reorganizations or mergers, as applicable (each, a “Reorganization” and collectively, the “Reorganizations”). Additionally, each of the Survivor Funds, as identified below, adopted a Discount Management Program that seeks to enhance long-term shareholder value via periodic liquidity events if certain conditions are met (s...
-
Gabriella Paradiso Appointed Director at Dextra Partners
NEW YORK--(BUSINESS WIRE)--Dextra Partners, a multi-strategy private equity firm focused on the middle market, today announced the promotion of Gabriella (“Gab”) Paradiso to Director. Ms. Paradiso is a key contributor within the operations team, overseeing investor relations, portfolio analytics, and ESG. “Gab’s ability to work seamlessly across functions makes her an essential leader on our operations team,” said Dextra’s founding partners. “Her promotion reflects Gab’s exceptional work ethic,...

-
Risewell Homes Schedules Earnings Conference Call for the Fiscal 2026 First Quarter
IRVINE, Calif.--(BUSINESS WIRE)--Risewell Homes today announced that the Company will release its financial results for the fiscal 2026 first quarter on its confidential data site on Friday, February 13, 2026. The Company will also host a conference call beginning at 8:00 AM Pacific Time (11:00 AM Eastern Time) on Friday, February 13, 2026, to review the results, discuss recent events and conduct a question-and-answer period. The earnings release, investor presentation, conference call and webc...
-
Octave Specialty Group to Release Fourth Quarter 2025 Results on February 23, 2026
NEW YORK--(BUSINESS WIRE)--Octave Specialty Group to Release Fourth Quarter 2025 Results on February 23, 2026...
-
ProCap Financial Strengthens Balance Sheet Through Strategic Deleveraging and Share Repurchases
NEW YORK--(BUSINESS WIRE)--ProCap Financial, Inc. (Nasdaq: BRR) (“ProCap Financial” or the “Company”), the first publicly traded agentic finance firm, today announced significant balance sheet improvements following the Company’s share repurchases, debt reduction, and continued Bitcoin accumulation. The Company has executed a comprehensive deleveraging strategy that included repurchasing approximately $135 million of its convertible notes for $119 million today. The Company has repurchased appr...

-
The O’Connor Group Launches 57th Street Partners
KING OF PRUSSIA, Pa.--(BUSINESS WIRE)--The O'Connor Group, a leading HR outsourcing and recruitment firm, announces today the launch of 57th Street Partners, a boutique executive search firm designed to connect top-level executives with transformative opportunities to drive innovation in the life sciences, technology, energy, and professional services industries. As CEO and founder of The O’Connor Group, Marcia Zaruba O’Connor envisioned a dedicated practice built on earned trust and strategic...
-
Empery Digital Announces Update on Share Repurchase Program
AUSTIN, Texas--(BUSINESS WIRE)--Empery Digital Inc. (NASDAQ: EMPD) (the “Company” or “Empery Digital”) today announced an update on its previously authorized share repurchase program. As of February 6, 2026, the Company has repurchased 15,403,738 shares of its common stock under its $200 million share repurchase program, at an average purchase price per share of $6.71, including all fees and commissions. Following these repurchases, the current number of shares outstanding is 36,016,497, after...
-
La 5ème Assemblée générale de la DCO s’achève avec l’adoption de la Déclaration du Koweït sur l’intelligence artificielle responsable pour la prospérité numérique mondiale
KOWEÏT CITY, Koweït--(BUSINESS WIRE)--L'Organisation de coopération numérique (DCO) a clôturé sa cinquième Assemblée générale, avec l’adoption par les États membres de la ‘Déclaration du Koweït sur l’intelligence artificielle (IA) pour la prospérité numérique mondiale’. Les États membres se sont accordés sur la nécessité d’une action collective et stratégique pour promouvoir une transformation numérique fiable, inclusive, et évolutive à l'ère de l'IA. Tenue les 4 et 5 février 2026 sous la prési...