

Newsroom
Sorted by: Latest
-
Dealroom and NATO Innovation Fund: European Defence, Security & Resilience Startups Smash Record with $8.7B Raised in 2025
AMSTERDAM & LONDON--(BUSINESS WIRE)--An exclusive new report by Dealroom and the NATO Innovation Fund shows that European DSR (Defence, Security and Resilience) startups secured a record $8.7 billion in venture capital in 2025. The surge was fuelled by late-stage mega-rounds to support breakthrough technologies that help address critical capabilities for NATO nations – from freedom of operations & mobility, to awareness and decision making, and the security of critical technologies. Record...
-
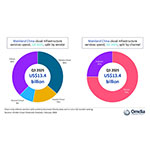
Omdia: Mainland China’s cloud infrastructure market accelerates to 24% growth in Q3 2025
LONDON--(BUSINESS WIRE)--According to Omdia, Mainland China’s cloud infrastructure services market reached $13.4 billion in Q3 2025, growing 24% year on year. This marked the second consecutive quarter of growth above 20%. Sustained AI demand continued to drive adoption while generating spillover effects across core cloud infrastructure services, accelerating the shift in cloud resource consumption toward production workloads. In response, leading cloud providers continued to build out AI capab...
-
SheltonAI potencia su expansión global y anuncia nuevos líderes estratégicos
SAN FRANCISCO--(BUSINESS WIRE)--SheltonAI, la plataforma de inteligencia artificial para inversores institucionales en mercados privados, anunció nuevos líderes, una expansión global significativa y un rápido crecimiento al iniciar 2026. Entre los nuevos líderes se destacan: Stephen Can, director de estrategia, con experiencia como presidente ejecutivo y fundador de Blackstone Strategic Partners Peter Song, director de operaciones, anteriormente en Blackstone Strategic Partners Chris Cooper, di...
-
Yubico Announces Availability of the YubiKey 5 CCN Series, First Hardware Security Key to Secure 'ENS Alta' Rating in Spanish National Cryptologic Center (CCN)'s CPSTIC Catalogue
STOCKHOLM--(BUSINESS WIRE)--Regulatory News: Yubico (NASDAQ STOCKHOLM: YUBICO), a modern cybersecurity company and creator of the most secure passkeys, today announced the availability of the YubiKey 5 CCN Series in Spain. Tailored specifically for the Spanish market, the series is now officially listed in the Spanish National Cryptologic Centre (CCN) Catalogue of Information and Communication Technology Products and Services. Following a rigorous LINCE evaluation, the YubiKey 5 CCN Series has...
-
Parade Technologies Reports Fourth Quarter and Fiscal 2025 Financial Results
SAN JOSE, Calif.--(BUSINESS WIRE)--Parade Technologies Reports Fourth Quarter and Fiscal 2025 Financial Results...
-
NTT DATA Appoints Seelan Nayagam as Asia Pacific CEO
LONDON--(BUSINESS WIRE)--NTT DATA, a global leader in AI, digital business and technology services, today announced the appointment of Seelan Nayagam as the new Chief Executive Officer for Asia Pacific at NTT DATA, Inc., effective March 16, 2026, based in Singapore. Nayagam succeeds John Lombard and will report directly to NTT DATA, Inc. President and CEO, Abhijit Dubey. Nayagam brings over two decades of leadership experience in driving digital transformation, enterprise technology services an...

-
Rosen Law Firm Urges Inovio Paysafe Limited (NASDAQ: PSFE) Stockholders to Contact the Firm for Information About Their Rights
NEW YORK--(BUSINESS WIRE)--Rosen Law Firm, a global investor rights law firm, announces a class action lawsuit on behalf of purchasers of securities of Paysafe Limited (NYSE: PSFE) between March 4, 2025 and November 12, 2025. Paysafe describes itself as a company that “provides end-to-end payment solutions in the United States and internationally.” For more information, submit a form, email attorney Phillip Kim, or give us a call at 866-767-3653. The Allegations: Rosen Law Firm is Investigating...
-
SheltonAI gibt globale Expansion, Ernennung neuer Führungskräfte und beschleunigtes Wachstum bekannt
SAN FRANCISCO--(BUSINESS WIRE)--SheltonAI, die institutionelle KI-Plattform für Bewertungen, gab die Ernennung neuer Führungskräfte, eine bedeutende globale Expansion und ein starkes Wachstumspotenzial bis zum Jahr 2026 bekannt. SheltonAI hat mehrere Ernennungen in leitenden Positionen bekannt gegeben, darunter: Stephen Can, CSO, zuvor Executive Chairman und Gründer von Blackstone Strategic Partners Peter Song, COO, zuvor COO von Blackstone Strategic Partners Chris Cooper, CFO, zuvor Global CFO...
-
4Moving Biotech Announces the Closing of a €12 Million Financing to Advance a First-in-Class DMOAD in Knee Osteoarthritis
LILLE, France & PARIS--(BUSINESS WIRE)--4Moving Biotech announces the closing of a €12 million financing to advance a first-in-class DMOAD in the knee osteoarthritis...

-
Brian McCarthy se incorpora a Cursor como presidente de Ingresos Globales y Operaciones de Campo
SAN FRANCISCO--(BUSINESS WIRE)--Brian McCarthy se suma a Cursor como presidente de Ingresos Globales y Operaciones de Campo Brian es un consumado ejecutivo de software empresarial con más de 20 años de experiencia en la creación y ampliación de organizaciones globales de comercialización en entornos de alto crecimiento. Se suma a Cursor en un momento crucial de crecimiento en el que las empresas globales se replantean la manera en que se crea software en la era de la IA. Recientemente, Brian oc...