Newsroom
Sorted by: Latest
-
SunOpta Investor Alert: Kahn Swick & Foti, LLC Investigates Adequacy of Price and Process in Proposed Sale of SunOpta Inc. - STKL
NEW YORK & NEW ORLEANS--(BUSINESS WIRE)--Former Attorney General of Louisiana Charles C. Foti, Jr., Esq. and the law firm of Kahn Swick & Foti, LLC (“KSF”) are investigating the proposed sale of SunOpta Inc. (NasdaqGS: STKL) to Refresco. Under the terms of the proposed transaction, shareholders of SunOpta will receive $6.50 in cash for each share of SunOpta that they own. KSF is seeking to determine whether this consideration and the process that led to it are adequate, or whether the consi...

-
Marine Products Investor Alert: Kahn Swick & Foti, LLC Investigates Adequacy of Price and Process in Proposed Sale of Marine Products Corporation - MPX
NEW YORK & NEW ORLEANS--(BUSINESS WIRE)--Former Attorney General of Louisiana Charles C. Foti, Jr., Esq. and the law firm of Kahn Swick & Foti, LLC (“KSF”) are investigating the proposed sale of Marine Products Corporation (NYSE: MPX) to MasterCraft Boat Holdings, Inc. (NasdaqGM: MCFT). Under the terms of the proposed transaction, shareholders of Marine Products will receive $2.43 in cash and 0.232 shares of MasterCraft common stock for each share of Marine Products that they own. Upon clos...

-
Thermo Fisher Scientific Prices Offering of USD-Denominated Senior Notes
WALTHAM, Mass.--(BUSINESS WIRE)--Thermo Fisher Scientific Inc. (NYSE: TMO) (“Thermo Fisher”) announced today that it has priced an offering of $3.8 billion aggregate principal amount (the “Offering”) of the following notes: $1.0 billion aggregate principal amount of its 4.215% senior notes due 2031 (the “2031 notes”) at the issue price of 100.000% of their principal amount; $750 million aggregate principal amount of its 4.550% senior notes due 2033 (the “2033 notes”) at the issue price of 99.78...
-
Kirin and Immunosens Launch Joint Development of a Self-Testing Service That Uses Urinary IgA to Visualize a Person’s Immune Status
TOKYO & OSAKA, Japan--(BUSINESS WIRE)--Kirin Holdings Company, Limited (Kirin Holdings) and Immunosens Co., Ltd. (Immunosens) have begun the joint development of a unique “Self-Testing Service*1” designed to visualize a person’s immune status. Through the KIRIN HEALTH INNOVATION FUND, a corporate venture capital fund jointly established in February 2023 with Global Brain Corporation, one of Japan’s leading independent venture capital firms, Kirin Holdings invested in Immunosens*2 and has been e...
-
CORRECTING and REPLACING Backed by OpenAI, Tesla, and SpaceX Investors, Midas Is Building Mathematical Infrastructure to Secure AI Systems
NEW YORK--(BUSINESS WIRE)--Backed by OpenAI, Tesla, and SpaceX Investors, Midas Is Building Mathematical Infrastructure to Secure AI Systems...
-
Xsolla bringt seine Expertise im Bereich Mobile-First-Monetarisierung zum Gamesforum Barcelona 2026 ein, wo sich die führenden Unternehmen der europäischen Mobile-Gaming-Branche versammeln, um die größten Wachstumsherausforderungen...
LOS ANGELES--(BUSINESS WIRE)-- Xsolla bringt seine Expertise im Bereich Mobile-First-Monetarisierung zum Gamesforum Barcelona 2026 ein, wo sich die führenden Unternehmen der europäischen Mobile-Gaming-Branche versammeln, um die größten Wachstumsherausforderungen der Branche zu lösen Xsolla, ein weltweit tätiges Unternehmen im Bereich Videospielhandel, das Entwickler bei der Veröffentlichung, Weiterentwicklung und Monetarisierung ihrer Spiele unterstützt, hat heute seine Teilnahme am Gamesforum...

-
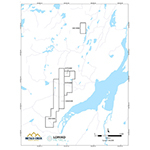
Lomiko Metals Pays the 1st Anniversary Payment for the Yellow Fox Property to Metals Creek and Adds Claims to the Agreement
MONTREAL--(BUSINESS WIRE)--Lomiko Metals Inc. (TSX.V: LMR) (“Lomiko” or the “Company”) is pleased to announce that further to its agreement with Metals Creek (“Lomiko”) (see news release dated 22 January 2025) in regards to the Yellow Fox Property, the Company will be paying the first anniversary payment of $23,125 and 889,423 shares of Lomiko Metals Inc. at a deemed price of $0.13 per share subject exchange approval. The company has also paid the first-anniversary payment to the finder of $1,8...
-
FPT Achieves HITRUST r2 v11.5.1 Certification, Demonstrating the Highest Level of Information Protection Assurance
HANOI, Vietnam--(BUSINESS WIRE)--FPT, a leading global IT company, announced its in-scope platforms and facilities of FPT Data Center have earned certified status from HITRUST for cybersecurity and information protection. The scope of the HITRUST r2 v11.5.1 certification includes FPT’s Application Services System, Database System, and Deployment System, all hosted and managed within the FPT Data Center in Hanoi, Vietnam, as well as the data center facility itself. The HITRUST Certification demo...
-
TOPONE Markets Advances AI-Powered Analytical Tools, Deepens Service Presence in Vietnam
HO CHI MINH CITY, Vietnam--(BUSINESS WIRE)--Amid growing market volatility and increasing information density across global financial markets, traders are placing greater emphasis on the efficiency of market analysis and the quality of decision‑support tools. TOPONE Markets has announced today that it will further strengthen its service infrastructure in Vietnam through AI‑driven analytical tools and a diversified trading support framework, enhancing its local presence and assisting investors i...

-
TOPONE Markets 推動 AI 智慧分析工具,深化台灣市場服務佈局
台北--(BUSINESS WIRE)--(美國商業資訊)-- 隨著全球金融市場波動幅度與資訊密度持續提高,交易者對市場資訊解析效率與決策支援品質的期待日益提升。TOPONE Markets 近日宣布,將進一步深化台灣市場服務體系,透過 AI 智慧分析工具與多元化交易支援架構,強化在地服務佈局,協助投資人以更理性、系統化的方式理解黃金、外匯及美股指數等主流市場動態。 在智慧分析工具方面,TOPONE Markets 整合專業圖表系統與自主研發的 AI 智慧指標模型,針對價格行為與市場結構進行多維度分析,提供市場趨勢、波動狀態與關鍵價位的解析參考。平台強調,相關工具皆以「輔助理解與判斷」為核心設計理念,並非投資建議或自動交易系統,目的在於提升資訊透明度與決策參考品質。 其中,「AI 形態識別」運用 AI 電腦視覺與深度學習模型,自動分析大量行情圖表,辨識頂部、底部、三角形、旗形等常見技術形態,協助使用者更有效率地理解市場結構變化,降低人工判讀所需的時間成本與主觀差異。 「Alpha 趨勢」則結合深度強化學習(DRL)與量化演算法,並融合移動平均線、布林通道與 ATR 等分析工具,用於解析...