

Newsroom
Sorted by: Latest
-
UK Debt Management Office UK Regulatory Announcement: Issue of Debt
LONDON--(BUSINESS WIRE)-- DMO-TAS041/3627/002 The Minster Building21 Mincing LaneLondonEC3R 7AG T 020 7862 6500F 020 7862 6509www.dmo.gov.uk A021\26 11 February 2026 PRESS NOTICE RESULT OF THE SALE BY TENDER OF UP TO £300 MILLION OF 4¼% TREASURY GILT 2049The United Kingdom Debt Management Office ("DMO") announces that the tender of up to £300 million of 4¼% Treasury Gilt 2049 (ISIN Code: GB00B39R3707) has been allocated as follows:(Note: all prices in this notice are...
-
Conseil en IA agentique : Sia accélère son développement, avec plus de 400 agents sur son Agent Store
PARIS--(BUSINESS WIRE)--Sia, groupe international de conseil en stratégie, management et IA, né à l’ère du digital et comptant aujourd’hui plus de 3 000 consultants à l’échelle mondiale, franchit une nouvelle étape dans le déploiement d’agents IA. D’une plateforme d’IA générative à un Agent Store, adressant tous les secteurs et métiers Après avoir dévoilé pour la première fois sa plateforme GenAI à destination de ses clients en juin 2023, le cabinet a annoncé le lancement de son Agent Store en...
-
Agentic AI Consulting: Sia Accelerates Its Development with More Than 400 Agents on Its Agent Store
PARIS--(BUSINESS WIRE)--After unveiling its Generative AI platform to clients in June 2023, Sia announced the launch of its Agent Store in September 2025....
-
BeOne Medicines to Announce Fourth Quarter and Full Year 2025 Financial Results on February 26
SAN CARLOS, Calif.--(BUSINESS WIRE)--BeOne Medicines Ltd. (NASDAQ: ONC; HKEX: 06160; SSE: 688235), a global oncology company, will report its fourth quarter and full year 2025 financial results on Thursday, February 26, 2026 before the financial markets open. Following the release of the financials, the Company will host a live webcast with management at 8:00 a.m. ET. The live webcast of this event can be accessed from the investors section of the Company’s website at https://ir.beonemedicines....
-
PitchBook Introduces the First Daily Valuation Model for VC-Backed Companies
SEATTLE--(BUSINESS WIRE)--PitchBook, the leading private capital market intelligence platform, today announced the launch of PitchBook Valuation Estimates, the industry’s first daily, standardized valuation framework designed to improve transparency in private markets by delivering a consistent, independent, and data-informed valuation signal across thousands of VC-backed companies. Built to reflect how markets are pricing companies today—not at the last funding event—the model combines machine...
-
Horizon Technology Finance and Monroe Capital Support OSSIO with a $50 Million Credit Facility for Continued Growth
FARMINGTON, Conn. & CHICAGO--(BUSINESS WIRE)--Horizon Technology Finance Corporation (NASDAQ: HRZN) (“Horizon”), together with Monroe Capital LLC (“Monroe”), today announced the closing of an initial $40 million senior credit facility for Ossio Inc. (“OSSIO”), with an additional $10 million available to support future growth. Founded in 2014, OSSIO is an orthopedics company committed to transforming the surgical experience for patients, physicians, providers and payors. The company’s vision is...

-
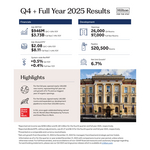
Hilton Reports Fourth Quarter and Full Year Results
MCLEAN, Va.--(BUSINESS WIRE)--Hilton Worldwide Holdings Inc. ("Hilton," "the Company," "we," "us" or "our") (NYSE: HLT) today reported its fourth quarter and full year 2025 results. Highlights include: Diluted EPS was $1.27 for the fourth quarter and $6.12 for the full year Diluted EPS, adjusted for special items, was $2.08 for the fourth quarter and $8.11 for the full year Net income was $298 million for the fourth quarter and $1,461 million for the full year Adjusted EBITDA was $946 million f...
-
QXO to Buy Kodiak Building Partners for $2.25 Billion
GREENWICH, Conn. & ENGLEWOOD, Colo.--(BUSINESS WIRE)--QXO, Inc. (NYSE: QXO) today announced it has entered into a definitive agreement to acquire Kodiak Building Partners (“Kodiak”) from Court Square Capital Partners for approximately $2.25 billion. The transaction is expected to be highly accretive to 2026 earnings and will expand QXO’s current addressable market to more than $200 billion. The purchase price comprises $2.0 billion of cash and 13.2 million shares, with QXO retaining the right t...
-
SiteOne Landscape Supply Announces Fourth Quarter and Full Year 2025 Earnings
ROSWELL, Ga.--(BUSINESS WIRE)--SiteOne Landscape Supply, Inc. (the “Company” or “SiteOne”) (NYSE: SITE) announced earnings for its fourth quarter (“Fourth Quarter 2025”) and full fiscal year ended December 28, 2025 (“Fiscal 2025”). “The fourth quarter marked a good close to a challenging year as we delivered positive Organic Daily Sales growth and continued adjusted EBITDA margin expansion despite a persistently unfavorable operating environment,” said Doug Black, SiteOne’s Chairman and CEO. “W...
-
Blaize Appoints Stephen Patak as Chief Revenue Officer to Accelerate Go-to-Market Execution
EL DORADO HILLS, Calif.--(BUSINESS WIRE)--Blaize Holdings, Inc. (NASDAQ: BZAI, NASDAQ: BZAIW) (“Blaize”), a leading AI infrastructure provider powering next-gen intelligent systems, today announced the appointment of Stephen Patak as Chief Revenue Officer. In this role, Patak will lead Blaize’s global revenue and go-to-market execution as the company expands real-world AI deployments across public and private sector markets. Blaize has reached a pivotal stage of growth, with its AI platform pro...