Newsroom
Sorted by: Latest
-
Millennium Partners, L.P. UK Regulatory Announcement: Form 8.3
LONDON--(BUSINESS WIRE)-- Ap27 FORM 8.3 IRISH TAKEOVER PANEL OPENING POSITION DISCLOSURE/DEALING DISCLOSURE UNDER RULE 8.3 OF THE IRISH TAKEOVER PANEL ACT, 1997, TAKEOVER RULES, 2022 BY PERSONS WITH INTERESTS IN RELEVANT SECURITIES REPRESENTING 1% OR MORE 1. KEY INFORMATION (a) Full name of discloser Millennium International Management LP (b) Owner or controller of interests and short positions disclosed, if different from 1(a) The naming of nominee or vehicle companies is insufficient. For a...
-
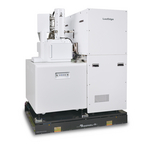
JEOL : lancement commercial du système SEM laser « LazEdge »
TOKYO--(BUSINESS WIRE)--JEOL Ltd. (président-directeur général : Izumi Oi) a développé le « LazEdge », un système SEM équipé d’un système de traitement laser, dont la commercialisation débutera le 25 mai 2026. Les instruments de préparation de coupes transversales, tels que le système à faisceau ionique focalisé (système FIB), sont couramment utilisés dans les domaines scientifiques et technologiques au sein des instituts de recherche, des universités et des industries. Ces dernières années, la...
-
InterSystems e Infinity Hub firmam parceria estratégica para transformar a jornada do paciente no Brasil
SÃO PAULO--(BUSINESS WIRE)--A InterSystems, fornecedora líder de soluções de última geração para as transformações digitais corporativas, anuncia sua nova parceria estratégica com a Infinity Hub, plataforma especializada em soluções para a jornada do paciente. A colaboração integra a robusta tecnologia de dados da InterSystems às ferramentas de engajamento da Infinity Hub, oferecendo ao mercado uma solução unificada que combina agilidade no atendimento e governança de dados de classe mundial. A...
-
Avec son VF 8 Eco, VinFast démontre que les versions standard ne sont plus synonymes de compromis
MARKHAM, Ontario--(BUSINESS WIRE)--Les acheteurs canadiens pourraient être surpris d'apprendre qu'ils peuvent acquérir un véhicule électrique neuf pour moins que certaines voitures d'occasion. Selon un rapport, le prix moyen d'un véhicule neuf au Canada était d'environ 49 500 $ au cours du premier trimestre 20261, toutes motorisations confondues. Sur la même période, le prix moyen des véhicules d'occasion oscillait toujours autour des 37 700 $2. Voici maintenant où la « magie » opère : le VinFa...

-
First Trust Global Funds PLC UK Regulatory Announcement: Net Asset Value(s)
LONDON--(BUSINESS WIRE)-- Funds Date TIDM ISIN Code Shares in Issue Currency Net Asset Value NAV/per Share First Trust SMID Rising Dividend Achievers UCITS ETF 22.05.2026 SDVY.LN IE0001R850E1 14,604,007.00 USD 362,522,673.78 24.824 ...
-
First Trust Global Funds PLC UK Regulatory Announcement: Net Asset Value(s)
LONDON--(BUSINESS WIRE)-- Funds Date TIDM ISIN Code Shares in Issue Currency Net Asset Value NAV/per Share First Trust Growth Strength UCITS ETF 22.05.2026 FTGS.LN IE000YZLMXT9 25,002.00 USD 574,825.28 22.991 ...
-
First Trust Global Funds PLC UK Regulatory Announcement: Net Asset Value(s)
LONDON--(BUSINESS WIRE)-- Funds Date TIDM ISIN Code Shares in Issue Currency Net Asset Value NAV/per Share First Trust Vest U.S. Equity Moderate Buffer UCITS ETF - February 22.05.2026 GFEB.LN IE000X8M8M80 700,002.00 USD 27,318,217.30 39.026 ...
-
First Trust Global Funds PLC UK Regulatory Announcement: Net Asset Value(s)
LONDON--(BUSINESS WIRE)-- Funds Date TIDM ISIN Code Shares in Issue Currency Net Asset Value NAV/per Share First Trust Vest S&P 500 Dividend Aristocrats Target Income UCITS ETF 22.05.2026 KNG.LN IE000SNMGYT5 900,002.00 USD 18,104,124.85 20.116 ...
-
Biznet Enhances Digital Infrastructure and Connectivity with Ciena
JAKARTA, Indonesia--(BUSINESS WIRE)--Biznet, an integrated digital infrastructure company in Indonesia, has deployed Ciena’s (NYSE: CIEN) WaveLogic 5 Extreme (WL5e) on the international link of its submarine cable Biznet Nusantara Cable System-1 (BNCS-1), providing inter-island connectivity across Java, Sumatra and Bangka Islands. This upgrade aims to deliver 400G high-speed services, faster and more reliable internet connectivity, while also accelerating digitalization in Indonesia by enhancin...
-
TVS Motor Company Ranked #1 Globally For Shareholder Value Creation In ‘Durable Consumer Goods’ By WirtschaftsWoche And Boston Consulting Group
BENGALURU, India--(BUSINESS WIRE)--TVS Motor Company has been ranked #1 globally in the ‘Durable Consumer Goods’ category in the annual ‘Best Stocks in the World’, ranking....