

Newsroom
Sorted by: Latest
-
Cigar Lake Mine Resumes Production
SASKATOON, Saskatchewan--(BUSINESS WIRE)--Cameco (TSX: CCO; NYSE: CCJ) today announced our Cigar Lake mine in northern Saskatchewan has resumed production activities following a temporary suspension due to challenges at Orano’s McClean Lake mill, where Cigar Lake ore is processed. The McClean Lake mill has now resumed operations. Cigar Lake has begun shipping stockpiled ore to the mill and has restarted production at the mine. Our 2026 production outlook range for Cigar Lake has not been impact...
-
Superior Industries Announces Closing of Senior Financing Facility
SOUTHFIELD, Mich.--(BUSINESS WIRE)--Superior Industries International, Inc. (“Superior” or the “Company”) today announced the successful closing of a senior financing facility with PNC Bank, N.A. The financing strengthens Superior’s liquidity position, provides enhanced financial flexibility, and establishes a committed banking relationship to support the Company’s operating priorities and long-term strategic plan. The financing also provides additional capacity to execute key initiatives acros...
-
Aethon Energy Management Completes Transformational Haynesville Sale and Advances Strategic Evolution as Leading Energy-Focused Investment Manager
DALLAS--(BUSINESS WIRE)--Aethon Energy Management LLC (“Aethon”) today announced that it has successfully completed the previously announced sale of 100% of the equity interests of Aethon United LP and Aethon III LLC, as well as certain other related operational, production and midstream entities and interests (“the Aethon Fund II and Fund III Assets”), to Mitsubishi Corporation (“Mitsubishi”). The transaction represents a complete sale for all Aethon United and Aethon III limited partners, and...
-
Laird Superfood’s Chief Financial Officer Announces Resignation
BOULDER, Colo.--(BUSINESS WIRE)--Laird Superfood, Inc. (NYSE American: LSF) (the “Company”) today announced that Anya Hamill will resign from her position as Chief Financial Officer, effective August 31, 2026. “We thank Anya for her contributions to Laird Superfood and wish her continued success in her future endeavors,” said Jason Vieth, President and Chief Executive Officer. The Company has commenced a search process, including both internal and external candidates, to identify a new permanen...
-
Neuraptive Therapeutics تحصل على ترخيص من جامعة واشنطن في سانت لويس لتقنية مبتكرة لتحفيز الأعصاب قابلة للامتصاص الحيوي
تشيستربروك، بنسلفانيا--(BUSINESS WIRE)--اليوم، أعلنت شركة Neuraptive Therapeutics, Inc.، وهي شركة للتكنولوجيا الحيوية في المرحلة السريرية تركز على إصابات الأعصاب الطرفية، أنها حصلت على ترخيص حصري من جامعة واشنطن في سانت لويس لجهاز تحفيز إلكتروني لاسلكي قابل للامتصاص الحيوي.تم تطوير هذه التقنية من قبل باحثين في كلية الطب بجامعة واشنطن بالتعاون مع جامعة نورث وسترن، وهي تقوم بتوصيل نبضات كهربائية موجهة إلى الأعصاب التالفة لتسريع عملية التجديد. والجهاز قابل للامتصاص الحيوي بالكامل، مما يعني أنه يت...
-
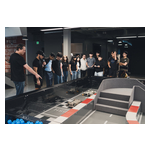
Faraday Future Launches Immersive FF Nexus Academy Summer Camps for Los Angeles Students, Advancing Its Embodied AI Robotics Education Strategy
LOS ANGELES--(BUSINESS WIRE)--Faraday Future Intelligent Electric Inc. (NASDAQ: FFAI) (“Faraday Future”, “FF” or the “Company”), a California-based global Embodied AI (EAI) ecosystem company, announced today that it began its second week of three flagship demonstration robotics summer camps. The Company has partnered with two major public-school districts in Los Angeles — Lynwood Unified School District and El Segundo Unified School District, where FF’s new headquarters is located — to host the...
-
Clearside Biomedical, Inc. Completes Financial Restructuring and Emerges from Chapter 11 with Steel Partners as Plan Sponsor
NEW YORK--(BUSINESS WIRE)--Clearside Biomedical, Inc. (“Clearside” or the “Company”) today announced that it has completed its financial restructuring and emerged from Chapter 11. All conditions to the effectiveness of the Company’s plan of reorganization (the “Plan”), as confirmed by the United States Bankruptcy Court for the District of Delaware, have been satisfied or waived, and the Plan became effective on the closing date. The Plan was sponsored by Steel Partners, Ltd. (“Steel Partners”),...
-
Neuraptive Therapeutics 获得圣路易斯华盛顿大学创新生物可吸收神经刺激技术授权许可
宾夕法尼亚州切斯特布鲁克--(BUSINESS WIRE)--(美国商业资讯)-- 专注于周围神经损伤治疗的临床阶段生物技术公司 Neuraptive Therapeutics, Inc. 今日宣布,已与圣路易斯华盛顿大学达成独家许可协议,获得一项生物可吸收无线电子神经刺激装置技术的独家授权。 该技术由圣路易斯华盛顿大学医学院研究人员联合西北大学合作研发,可通过向受损神经精准输送电脉冲,加速神经再生。该装置采用完全生物可吸收设计,可在人体内自然降解,无需接受后续手术进行取出。 圣路易斯华盛顿大学技术管理办公室助理副校长兼董事总经理 Nichole R. Mercier 博士表示:“WashU 很高兴与 Neuraptive 这样一家新兴企业携手合作,共同推进源自我校科研实验室的生物可吸收技术平台的开发。此次许可协议将推动该技术平台的进一步开发,加速其在周围神经修复领域的应用,并为患者带来切实获益。” Neuraptive Therapeutics 董事长兼首席执行官 Bob Radie 表示:“此次交易是我们进一步丰富产品组合、为神经损伤患者提供更多治疗选择的重要里程碑。这款生物可吸收...
-
ニューラプティブ・セラピューティクス、セントルイスのワシントン大学から革新的な生体吸収性神経刺激技術のライセンスを取得
ペンシルバニア州チェスターブルック--(BUSINESS WIRE)--(ビジネスワイヤ) -- 末梢神経損傷に注力する臨床開発段階のバイオテクノロジー企業であるニューラプティブ・セラピューティクスは、セントルイスのワシントン大学から、生体吸収性のワイヤレス電気刺激デバイスに関する独占ライセンスを取得したと発表しました。 WashU Medicineの研究者がノースウェスタン大学と共同で開発したこの技術は、損傷した神経に標的を絞って電気パルスを送ることで、神経再生を促進します。このデバイスは完全に生体吸収性で、体内で自然に分解されるため、除去のための追加手術を行う必要がありません。 「WashUは、本学の研究室から生まれた生体吸収性プラットフォームの開発を支援するため、ニューラプティブのような新興企業と提携できることをうれしく思います」と、WashUの副学長補佐で、技術マネジメント室のマネージングディレクターを務めるニコール・R・メルシエ(Nichole R. Mercier)博士は述べました。「本契約により、このプラットフォームの開発をさらに進め、末梢神経修復を促進し、患者さんに恩...
-
Riassunto: Neuraptive Therapeutics ottiene in licenza la tecnologia innovativa della stimolazione nervosa con dispositivi bioriassorbibili dalla Washington University a St. Louis
CHESTERBROOK, Pa.--(BUSINESS WIRE)--Neuraptive Therapeutics, Inc., azienda biotecnologica di fase clinica specializzata in lesioni dei nervi periferici, ha annunciato oggi di aver ottenuto una licenza esclusiva dalla Washington University a St. Louis per un dispositivo elettronico per la stimolazione wireless bioriassorbibile. Sviluppato da ricercatori della facoltà di medicina della WashU in collaborazione con la Northwestern University, la tecnologia emette pulsazioni elettriche mirate ai ner...