

Newsroom
Sorted by: Latest
-
Porter Airlines Joins International Air Transport Association
TORONTO--(BUSINESS WIRE)--Porter Airlines has officially joined the International Air Transport Association (IATA) as a member. This significant milestone reflects the airline's rapid growth and its deepening integration with the global aviation community. Full membership follows Porter's successful completion of the IATA Operational Safety Audit (IOSA) for its Embraer E195-E2 fleet in February 2026. These accomplishments mark a meaningful step forward in Porter's evolution as a carrier with ex...
-
Sterlington Advises ECHO Realty Management Team on $2 Billion Sale
NEW YORK--(BUSINESS WIRE)--Sterlington advised the management team of ECHO Realty ("ECHO"), a full-service owner and operator of best-in-class grocery-anchored retail real estate, on its recently announced acquisition of the company by TPG Real Estate ("TPG"), in a transaction valued at approximately $2 billion. The transaction was led by TPG in partnership with leading global investment groups, including PSP Investments, La Caisse, and Norges Bank Investment Management. Sterlington advised the...

-
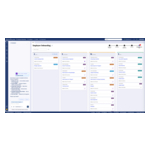
Pega Launches Customer Engagement Studio to Transform Marketing Operations with Agentic AI
LAS VEGAS--(BUSINESS WIRE)--Pegasystems Inc. (NASDAQ: PEGA), the enterprise AI software company for mission-critical work, today at PegaWorld® announced Pega Customer Engagement StudioTM, a new agentic user experience for Pega Customer Decision HubTM (CDH), the AI decisioning platform for scaling personalized experiences. Customer Engagement Studio brings together Pega and third-party agents in an intuitive workspace, helping marketers move from marketing brief to live personalized actions in m...

-
Pega Redefines AI‑Driven Transformation with Solution Designer Initiative
LAS VEGAS--(BUSINESS WIRE)--Pegasystems Inc. (NASDAQ: PEGA), the enterprise AI software company for mission-critical work, today at PegaWorld® announced the Pega Solution Designer Initiative, establishing a new generation of Solution Designers to overcome the biggest barrier to AI success: the gap between business intent and production-ready execution. Expanding the proven results of Pega’s Blueprint Delivered™ methodology, this initiative will scale Pega Blueprint AITM-led engagements by equip...
-
Pega Honors Partners at PegaWorld 2026 for Driving AI‑Powered Enterprise Transformation
LAS VEGAS--(BUSINESS WIRE)--Pegasystems Inc. (NASDAQ: PEGA), the enterprise AI software company for mission-critical work, today announced the winners of the 2026 Pega Partner Awards at its annual PegaWorld® user conference in Las Vegas. The awards recognize partners across Pega’s global ecosystem for leading enterprise-grade AI innovation and delivering exceptional client outcomes through high-value industry solutions, personalizing customer experiences, and modernizing critical systems. Pega...
-
Pega Powers AI Agents to Reliably Drive Mission-Critical Work
LAS VEGAS--(BUSINESS WIRE)--Pegasystems Inc. (NASDAQ: PEGA), the enterprise AI software company for mission-critical work, today at PegaWorld® announced new capabilities that enable enterprises to use their custom-built AI agents to drive essential business processes without sacrificing governance, compliance, or cost controls. With added support for the open MCP (Model Context Protocol) standard, Pega processes can now be discovered and executed by authorized third-party agents, including thos...

-
Pega Eliminates ‘AI Token Tax’ With More Efficient Way to Build and Run Agentic Workflows
LAS VEGAS--(BUSINESS WIRE)--Pegasystems Inc. (NASDAQ: PEGA), the enterprise AI software company for mission-critical work, today at PegaWorld® announced clients can now design, build, and run their agentic workflows across Pega Infinity™ 26 without paying per token. The Pega Predictable AI™ architecture shifts the heavy AI reasoning to design time, so runtime agents are fast, reliable, and dramatically cheaper to run. This directly addresses two of the most pressing obstacles for enterprises try...

-
Accenture to Acquire Leading Creator and Social Agency Whalar, from Whalar Group
NEW YORK--(BUSINESS WIRE)--Accenture has agreed to acquire Whalar, a leading creator and social agency, from Whalar Group....

-
Pega Harnesses Best Practices and AI Coding Agents to Build Apps with Mission-Critical Reliability
LAS VEGAS--(BUSINESS WIRE)--Pegasystems Inc. (NASDAQ: PEGA), the enterprise AI software company for mission-critical work, today at PegaWorld® launched Pega Infinity Studio™, an intuitive, AI-powered development environment for quickly building mission-critical applications without AI coding risks or extended learning curves. Pega Infinity Studio infuses the architectural and industry best practices of the Pega Blueprint AI™ workflow design agent into a reimagined, AI-first developer interface....
-
Pega Launches AI-Driven Modernization Capability on AWS To Reimagine Legacy Mainframe Apps Into Cloud-Native Systems
LAS VEGAS--(BUSINESS WIRE)--Pegasystems Inc. (NASDAQ: PEGA), the enterprise AI software company for mission-critical work, today at PegaWorld® announced the Pega Blueprint AI™ application design agent will be integrated within Amazon Web Services (AWS) Transform to help organizations modernize mainframe applications faster and with minimal friction. This integration simplifies enterprise transformation, allowing clients to extract and analyze their legacy COBOL code with AWS Transform and reima...
