Newsroom
Sorted by: Latest
-
Qube Research & Technologies LTD UK Regulatory Announcement: Form 8.3
LONDON--(BUSINESS WIRE)-- FORM 8.3 PUBLIC OPENING POSITION DISCLOSURE/DEALING DISCLOSURE BY A PERSON WITH INTERESTS IN RELEVANT SECURITIES REPRESENTING 1% OR MORE Rule 8.3 of the Takeover Code (the “Code”) 1. KEY INFORMATION (a) Full name of discloser: Qube Research & Technologies Limited (b) Owner or controller of interests and short positions disclosed, if different from 1(a): The naming of nominee or vehicle companies is insufficient. For a trust, the trustee(s), settlor and beneficiari...
-
The Global Mobile Medical Association Launches to Transform Community Healthcare with Unified Network
GREENSBORO, N.C.--(BUSINESS WIRE)--The Global Mobile Medical Association (GMMA), the world’s first comprehensive network dedicated to advancing the mobile healthcare model, officially launched today. GMMA represents a turning point for mobile medicine, uniting community health professionals, mobile health program operators, telemedicine champions, mobile integrated health professionals, and healthcare technology innovators under a shared mission: ensuring efficient access to and cost-effective...
-
Ai.com, Universal Pictures, and Lay’s Win Most Engaging Super Bowl LX Ads in EDO’s Annual TV Outcomes Ranker
NEW YORK--(BUSINESS WIRE)--EDO, the TV outcomes company, today released its annual ranking of all national Super Bowl LX ads, showcasing brands like Ai.com, Universal Pictures, and Lay’s in the lead with the most engaging spots of the night. For over a decade, EDO has scored every Super Bowl ad from pre-kick to post-game based on how effective each spot is at driving consumer behaviors — such as website visits and brand searches — immediately after the ads airing. “This year’s Super Bowl contin...
-
Milliman adds Minnesota Cement Masons as a retirement services client
SEATTLE--(BUSINESS WIRE)--Milliman, Inc., a premier global consulting, actuarial, and benefits administration firm, announced it has added Minnesota Cement Masons as a defined contribution client. Established on May 1, 2025, the Minnesota Cement Masons Defined Contribution Retirement Fund is a start-up Taft-Hartley retirement fund serving members of the Cement Masons, Plasterers, and Shophands Local 633 union. The fund supports workers across Minnesota, North Dakota, and Northwest Wisconsin. “W...
-
HTeaO Appoints Chris Phillips as Chief Financial Officer
FORT WORTH, Texas--(BUSINESS WIRE)--HTeaO, the nation’s leading iced tea franchise, today announced the appointment of Chris Phillips as Chief Financial Officer. In this role, Phillips will oversee the company’s finance, accounting, information technology, and strategic planning functions as HTeaO continues its rapid expansion across the U.S. Phillips brings more than two decades of experience leading finance and strategy for highly franchised, multi-brand restaurant organizations. His backgrou...

-
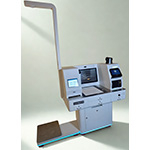
Zoya Technologies dévoile « ZoyeMed 3.0 » — une clinique autonome pilotée par l’IA, Edge-Native — au WHX Dubai
DUBAÏ, Émirats arabes unis--(BUSINESS WIRE)--Zoya Technologies a annoncé aujourd’hui le lancement de « ZoyeMed 3.0 », un kiosque/terminal clinique Edge-Native conçu pour fournir des soins primaires et aigus de manière autonome, tout en maintenant une supervision humaine. Le système a été présenté au WHX Dubai 2026. Il combine une IA embarquée (on-device), une détection multi-modale, des tests au point de soins (Point-of-Care), et une modélisation longitudinale du patient afin de soutenir des di...
-
Niagen Bioscience is the Premiere Sponsor of the Inaugural “NAD for Health: Opportunities & Challenges” Conference Hosted by the University of Copenhagen
LOS ANGELES--(BUSINESS WIRE)--Niagen Bioscience, Inc. (NASDAQ: NAGE), the global authority on NAD+ (nicotinamide adenine dinucleotide) with a focus on the science of healthy aging, today announces it is the headlining sponsor of the inaugural NAD for Health: Opportunities & Challenges scientific meeting hosted by the University of Copenhagen, taking place March 23–25, 2026 at the Royal Danish Academy of Sciences and Letters in central Copenhagen. Space is limited and registration is require...
-
BlackRock Announces Completion of Certain Municipal CEF Reorganizations and Adoption of Discount Management Program
NEW YORK--(BUSINESS WIRE)--BlackRock Advisors, LLC announced today each of the closed-end funds named below (each, a “Fund” and collectively, the “Funds”) have completed their reorganizations or mergers, as applicable (each, a “Reorganization” and collectively, the “Reorganizations”). Additionally, each of the Survivor Funds, as identified below, adopted a Discount Management Program that seeks to enhance long-term shareholder value via periodic liquidity events if certain conditions are met (s...
-
Gabriella Paradiso Appointed Director at Dextra Partners
NEW YORK--(BUSINESS WIRE)--Dextra Partners, a multi-strategy private equity firm focused on the middle market, today announced the promotion of Gabriella (“Gab”) Paradiso to Director. Ms. Paradiso is a key contributor within the operations team, overseeing investor relations, portfolio analytics, and ESG. “Gab’s ability to work seamlessly across functions makes her an essential leader on our operations team,” said Dextra’s founding partners. “Her promotion reflects Gab’s exceptional work ethic,...