

Newsroom
Sorted by: Latest
-
KBRA Assigns Preliminary Ratings to Ezee Fiber Funding, LLC, Series 2026-1
NEW YORK--(BUSINESS WIRE)--KBRA assigns preliminary ratings to the Series 2026-1, Class A-1-L Notes, Class A-1-V Notes, Class A-2 Notes, Class B Notes and Class C Notes (the Series 2026-1 Notes) from Ezee Fiber Funding, LLC (the Issuer), a communications infrastructure securitization. The transaction represents the Issuer’s first securitization. The transaction structure is a master trust, and as such, the indenture permits the issuance of additional classes and series of notes subject to certa...
-
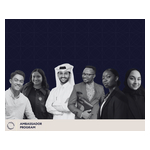
対話を通じて若い世代を育む「ドーハ・ディベート・アンバサダー・プログラム」とは
カタール、ドーハ--(BUSINESS WIRE)--(ビジネスワイヤ) -- 変化が続き、さまざまな言説がせめぎ合う世界では、耳を傾け、問いを投げかけ、建設的な対話に参加する力が、これまで以上に重要です。カタール財団が手がける「ドーハ・ディベート・アンバサダー・プログラム」を通じて、世界中の若者は、こうしたスキルを学ぶだけでなく、地域社会での活動や仕事、学業にも積極的に生かしています。 このオンライン教育プログラムは、世界各地の若者に、従来とは異なるディベートの進め方を教えています。参加者は、西洋式に意見を戦わせるのではなく、人々が気軽に集い、地域社会の課題について話し合う場であるマジュリスに根差した対話の手法を用います。毎年、80か国以上から400人を超える若者が集まり、互いの話に耳を傾け、さまざまな視点を理解し、複雑な問題の解決策を求めて協力することを学びます。 アルグーリ・マキ(19歳)は、カタール大学で工学を学ぶ学生です。アイデアが現実の変化につながる場に加わるという明確な目的を持ってプログラムに参加しました。その一方で、プログラムへの参加を通じて、自らの信念を起点に、物事...

-
Eine Generation durch Dialog prägen — das Doha Debates Ambassador Program
DOHA, Katar--(BUSINESS WIRE)--In einer Welt, in der Wandel und konkurrierende Narrative zur Norm geworden sind, ist die Fähigkeit, zuzuhören, Fragen zu stellen und einen konstruktiven Dialog zu führen, wichtiger denn je. Im Rahmen des „Doha Debates Ambassador Program“, einer Initiative der Qatar Foundation, erwerben junge Menschen aus aller Welt diese Fähigkeiten, die sie danach auch aktiv in ihren Gemeinschaften, im Berufsleben und während ihres Studiums anwenden können. Dieses Online-Bildungs...
-
以對話塑造一代人:走進Doha Debates大使計畫
卡達杜哈--(BUSINESS WIRE)--(美國商業資訊)-- 在一個充滿變革與各種敘事交織的世界,傾聽、提問和參與建設性對話的能力從未如此重要。透過由卡達基金會(Qatar Foundation)出品的Doha Debates大使計畫(Doha Debates Ambassador Program),來自世界各地的年輕人不僅在學習這些技能,更將它們積極地運用到各自的社群、職業和研究領域中。 這項線上教育計畫旨在教導全球年輕人如何進行與眾不同的辯論。參與者並非參與西方式的觀點交鋒,而是採用一種植根於「議會」(Majlis)的對話方式——一個用於討論社群議題的、友好開放的社交空間。每年,來自80多個國家的400多名年輕人齊聚一堂,學習如何傾聽彼此、理解不同觀點,並就複雜問題的解決方案展開合作。 19歲的Algoori Maki是卡達大學的一名工程學學生,她帶著明確的目標加入該計畫:希望置身於一個能夠將想法轉化為影響力的環境中。但她也從中領悟到如何將個人信念轉化為深思熟慮的探索。 Maki表示:「我過去認為辯論是為了證明自己的觀點並贏得爭論。但我的看法已經發生改變。如今,我將辯論視為一...

-
以对话塑造一代人:走进Doha Debates大使项目
卡塔尔多哈--(BUSINESS WIRE)--(美国商业资讯)-- 在一个充满变革与各种叙事交织的世界里,倾听、提问和参与建设性对话的能力从未如此重要。通过由卡塔尔基金会出品的Doha Debates大使项目,来自世界各地的年轻人不仅在学习这些技能,更在各自的社区、职业和研究领域中积极实践。 这项线上教育项目旨在教导全球年轻人如何进行与众不同的辩论。参与者并非参与西方式的观点交锋,而是采用一种植根于“议会”(Majlis)的对话方式——一个用于讨论社区议题的、友好开放的社交空间。每年,来自80多个国家的400多名青年齐聚一堂,学习如何倾听彼此、理解不同观点,并就复杂问题的解决方案展开协作。 19岁的Algoori Maki是卡塔尔大学的一名工程学学生,她带着明确的目标加入了该项目:希望置身于一个能够将想法转化为实际影响的环境中。但她也从中领悟到如何将个人信念转化为深思熟虑的探索。 Maki表示:“我过去认为辩论是为了证明自己的观点并赢得争论。但我的看法已经发生改变。如今,我将辩论视为一种探索想法、挑战假设和理解不同观点的方式。它关乎有目的地倾听。” 26岁的Mohammed Al-Q...

-
La Cámara de Comercio de Hollywood se expande al sector de la hospitalidad de lujo
HOLLYWOOD, California--(BUSINESS WIRE)--La Cámara de Comercio de Hollywood, reconocida por el icónico Hollywood Sign® y el Hollywood Walk of Fame®, se expande al sector de la hospitalidad de lujo mediante una alianza estratégica con The Scene Hotels & Resorts para lanzar Hollywood Hotels & Residences. The Scene Hotels & Resorts, respaldada por más de 40 años de experiencia combinada en los sectores de la hospitalidad, los viajes y el desarrollo de marcas, liderará el desarrollo y la...
-
PLM Fleet Wins Top Workplaces 2026 Award for Work-Life Flexibility
NEWARK, N.J.--(BUSINESS WIRE)--PLM Fleet has been named a 2026 Top Workplaces Culture Excellence Award winner for Work-Life Flexibility by Energage, a leading organization focused on workplace culture and employee engagement. This award honors organizations that have built a culture enabling employees to meet personal life demands while maintaining high performance. The Work-Life Flexibility award honors organizations that empower employees with flexibility while promoting supportive leadership...

-
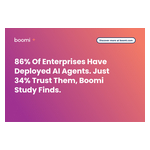
86% من المؤسسات قد نشرت وكلاء الذكاء الاصطناعي. توصلت دراسة Boomi إلى أنَّ 34% فحسب من المؤسسات تثق بهم.
كونشوهوكن، بنسلفانيا--(BUSINESS WIRE)--أعلنت اليوم شركة Boomi، الرائدة في مجال تفعيل البيانات لاستخدامها في تطبيقات الذكاء الاصطناعي، عن بحث جديد أجرته Forrester Consulting نيابةً عن Boomi، يُظهر أنه رغم التبني السريع لوكلاء الذكاء الاصطناعي في المؤسسات، فإنَّ مستوى الثقة لم يواكب مستوى الطموحات.يتناول هذا البيان الصحفي الوسائط المتعددة. يمكنك الاطلاع على البيان كاملاً هنا: https://www.businesswire.com/news/home/20260720360164/ar/تكشف دراسة مستقلة بتكليف من Boomi أنَّ التكامل، وليس النماذج الأكث...
-
Aptyx Appoints David Price as Chief Executive Officer
TEMPE, Ariz.--(BUSINESS WIRE)--Aptyx appoints David Price as CEO. Price previously served as CFO and will focus on growth, customer partnerships, and operational excellence....
-
Arcadia Capital Expands Tech and Tech Services Coverage with Senior Hire of Jon Wesner
LOS ANGELES--(BUSINESS WIRE)--Arcadia Capital announced today the appointment of Jon Wesner as a Managing Director. Jon joins the firm's senior advisory team, expanding Arcadia Capital's coverage of tech and tech services companies and investors, driving global M&A and growth capital dealmaking globally. Based in Los Angeles, Jon will lead the firm’s efforts across digital media, entertainment tech and related ecosystems. Jon joins Arcadia Capital with more than 15 years of experience in st...