

Newsroom
Sorted by: Latest
-
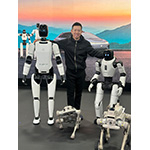
Faraday Future Founder and Co-CEO YT Jia Shares Weekly Investor Update: Reaffirms FF’s Commitment to Both the New Robotics Business and Existing Vehicle Business, Which Achieved a Milestone Relating to the FX Super One to be Announced Next Tuesday
LOS ANGELES--(BUSINESS WIRE)--Faraday Future Intelligent Electric Inc. (NASDAQ: FFAI) (“Faraday Future”, “FF” or the “Company”), a California-based global shared intelligent electric mobility ecosystem company, today shared a weekly business update from YT Jia, Founder and Global Co-CEO of FF. “This week, the launch of FF’s EAI Robotics products generated stronger-than-expected engagement. We trended at the top of major platforms across multiple channels. Thank you, sincerely, for following our...
-
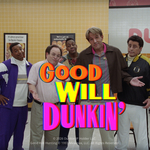
Dunkin’® Celebrates Its Iced Coffee Origin Story for Super Bowl LX with Good Will Dunkin’, a Never-Aired ’90s Sitcom Starring Ben Affleck and an All-Star Cast
BOSTON--(BUSINESS WIRE)--Dunkin’ is pressing rewind to a time when its iconic iced coffee hadn’t yet become a daily ritual, sitcoms ruled primetime and haircuts were characters in their own right. Tonight, during the biggest night in sports, Dunkin’ brings its iced coffee origin story to life with Good Will Dunkin’, a never-aired sitcom pilot set in 1995 – the same year the brand first put iced coffee in the spotlight. The episode follows the accidental “invention” of iced coffee inside a Dunki...
-
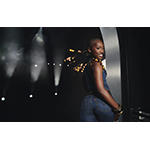
Levi’s® Brand Debuts “Behind Every Original” Campaign With Super Bowl Film Highlighting Backstories and Backsides
SAN FRANCISCO--(BUSINESS WIRE)--The Levi’s® brand today launched “Behind Every Original,” a bold new global campaign that celebrates the people who push culture forward — with one cheeky twist. Debuting during the Super Bowl with the anthem film “Backstory,” directed by Kim Gehrig, the Levi’s® brand flips expectations by showcasing both celebrity icons and everyday Originals exclusively from the backside, letting them share their game-changing Levi’s® backstory. Why the backside? Because it's t...
-
ICE Launches FTSE® South Korea RIC Capped Index Futures
NEW YORK & LONDON--(BUSINESS WIRE)--Intercontinental Exchange, Inc. (NYSE:ICE), a leading global provider of technology and data, today announced the launch of FTSE® South Korea RIC Capped Index Futures (FTSE® Korea futures). This new CFTC-approved contract (contract code: SKO), created in alignment with FTSE Russell and the Korea Exchange Inc. (KRX), combines FTSE Russell’s RIC Capped methodology - developed to support regulatory alignment and limit single‑name concentration - with KRX’s marke...
-
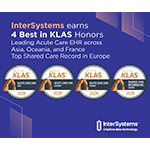
InterSystems榮獲四項2026年KLAS獎最佳獎
波士頓--(BUSINESS WIRE)--(美國商業資訊)-- 支援全球逾10億份病歷的創意資料科技供應商InterSystems今天宣布榮獲KLAS獎的四項全球最佳獎。該公司的亞洲、大洋洲與法國最佳急症護理電子病歷、以及歐洲最佳共享照護紀錄評等均拔得頭籌。 KLAS最佳獎是KLAS Research設立的年度獎項,表揚醫療保健科技與服務的頂尖解決方案,其評選完全以醫療保健供應者的反饋為準;由KLAS Research根據可反映客戶體驗和表現的標準化方法進行評估,頒獎給在特定軟體和服務市場細分領域內的參與者。除了美國市場之外,KLAS也在KLAS獎中另設全球(非美國)最佳獎表揚在海外做出頂尖表現的解決方案。全球最佳獎的評選以美國以外的醫療保健機構反饋為依據,並採用與美國獎相同的研究架構進行。 InterSystems勇奪以下四項2026年KLAS獎全球最佳獎: InterSystems TrakCare®榮獲KLAS三項最佳獎:法國最佳急症護理電子病歷獎、亞洲最佳急症護理電子病歷獎、大洋洲最佳急症護理電子病歷獎,說明該公司從這些市場的醫療保健機構獲得強有力的正面反饋。 歐洲最佳共享照...
-
InterSystems荣膺四项 “2026 KLAS最佳(Best in KLAS)”
波士顿--(BUSINESS WIRE)--(美国商业资讯)-- InterSystems是一家以创新数据技术见长的企业,在全球范围内支撑着逾10亿份健康记录。公司今日宣布荣膺四项“2026全球KLAS最佳(Best in KLAS)”。其中,InterSystems在亚洲、大洋洲及法国的急性护理电子病历(Acute Care EHR)领域排名第一,并在欧洲的共享护理记录(Shared Care Records)领域同样位居榜首。 “KLAS最佳(Best in KLAS)”由KLAS Research每年评选,旨在表彰医疗健康技术与服务领域中表现卓越的解决方案。该奖项的评选完全基于医疗服务机构的反馈,由KLAS Research采用统一、标准化的方法,对明确划分的软件与服务细分市场进行评估,全面反映客户体验与实际绩效。除美国市场外,KLAS Research还通过“全球(美国以外)KLAS最佳(Best in KLAS)”表彰国际市场中的领先解决方案。该全球性奖项同样基于美国以外医疗机构的反馈,并沿用一致的研究框架与评估标准。 InterSystems荣膺四项“2026全球KLAS最...

-
PFSI Investors Have Opportunity to Join PennyMac Financial Services, Inc. Fraud Investigation with the Schall Law Firm
LOS ANGELES--(BUSINESS WIRE)--PFSI Investors Have Opportunity to Join PennyMac Financial Services, Inc. Fraud Investigation with the Schall Law Firm...
-
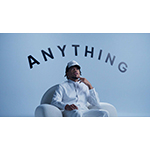
CoreWeave Introduces a New Brand Vision As the Cloud Built for This Moment
LIVINGSTON, N.J.--(BUSINESS WIRE)--CoreWeave, Inc. (Nasdaq: CRWV), The Essential Cloud for AI™, today debuted its first integrated brand campaign, “Ready for Anything, Ready for AI.” Featuring Chance the Rapper, the campaign marks a new brand vision centered on empowering pioneers investing in AI to push boundaries and accelerate breakthroughs in AI innovation. As the AI industry shifts from experimentation to large-scale production, CoreWeave’s new campaign highlights the company’s unique posi...
-
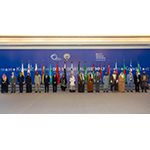
La DCO finaliza su 5.a Asamblea General con la adopción de la Declaración de Kuwait sobre la IA responsable para la prosperidad digital mundial
CIUDAD DE KUWAIT--(BUSINESS WIRE)--La Organización para la Cooperación Digital (Digital Cooperation Organization, DCO) ha dado por concluida su quinta Asamblea General, en la que los Estados miembros adoptaron la Declaración de Kuwait sobre la IA responsable para la prosperidad digital mundial y acordaron medidas para promover una transformación digital inclusiva, confiable y escalable en la era de la IA. Convocada los días 4 y 5 de febrero de 2026 bajo la presidencia del Estado de Kuwait, la A...
-
A DCO conclui a 5ª Assembleia Geral com a adoção da Declaração do Kuwait sobre IA Responsável para a Prosperidade Digital Global
KUWAIT CITY--(BUSINESS WIRE)--A Organização de Cooperação Digital (DCO) concluiu sua quinta Assembleia Geral, com os Estados-membros adotando a Declaração do Kuwait sobre IA Responsável para a Prosperidade Digital Global e concordando com ações para promover uma transformação digital inclusiva, confiável e escalável na era da IA. Convocada nos dias 4 e 5 de fevereiro de 2026 sob a presidência do Estado do Kuwait, a Assembleia Geral reuniu ministros e representantes dos Estados-membros, juntamen...
