Newsroom
Sorted by: Latest
-
Ryan Named to the UK's Best Workplaces for Wellbeing™ 2026 List
LONDON--(BUSINESS WIRE)--Ryan, a leading global tax services and software provider, has been named to the 2026 list of the UK’s Best Workplaces for Wellbeing™ by Great Place To Work®, marking the fifth consecutive year the Firm has earned this prestigious award. “This recognition reflects the culture our team members have helped create—one built on trust, flexibility, and a commitment to supporting one another,” said Tom Shave, President of Ryan's European and Asia-Pacific Operations. “We know...
-
Wolters Kluwer führt ADDISON Direkt ein, dass die Zusammenarbeit zwischen Steuerberatungskanzleien und Mandanten vereinfacht und die elektronische Rechnungsstellung unterstützt
LUDWIGSBURG, Deutschland--(BUSINESS WIRE)--Wolters Kluwer Tax & Accounting (TAA) Deutschland gab heute die Einführung von ADDISON Direkt bekannt, einer digitalen Kooperationsplattform, die Interaktion zwischen Steuerberatungskanzleien und ihren Mandanten in einer einzigen, optimierten Online-Umgebung vereinfacht und modernisiert. Als Weiterentwicklung von ADDISON OneClick vereint ADDISON Direkt ab Juli 2026 Kundenkommunikation, Dokumentenmanagement und elektronische Rechnungsstellung in ein...
-
BearingPoint strengthens global leadership with 14 new Partner promotions
AMSTERDAM--(BUSINESS WIRE)--Management and technology consultancy BearingPoint has announced the internal promotion of 14 new Partners, effective July 1. The appointments reflect the firm's continued commitment to developing leaders and supporting global growth under Strategy 2030, BearingPoint's roadmap for accelerating growth, expanding capabilities, and empowering people to succeed. Matthias Loebich, Managing Partner BearingPoint, said: “Empowering people and developing the next generation o...
-
NiCE Launches AI Specialization Program, Recognizing Partners Driving Significant AI Outcomes for Enterprises
HOBOKEN, N.J.--(BUSINESS WIRE)--NiCE (Nasdaq: NICE) today announced the launch of the NiCE AI Specialization Program, a formal, criteria-based recognition within the NiCE 360 Partner Program designed to recognize partners delivering measurable outcomes for enterprise organizations. As part of the launch, NiCE has named six inaugural AI Specialization partners: Accenture, Cirrus, Deloitte, TTEC, and Route 101. The NiCE AI Specialization Program establishes one of the industry's most rigorous sta...
-
Wolters Kluwer introduces ADDISON Direkt to simplify collaboration between tax firms and clients and support e-invoicing
LUDWIGSBURG, Germany--(BUSINESS WIRE)--Wolters Kluwer introduces ADDISON Direkt to simplify collaboration between tax firms and clients and support e-invoicing...
-
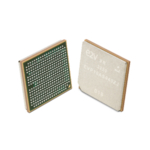
Teledyne e2v Strengthens Space-Grade ADC Offering with Radiation Robustness Results
GRENOBLE, France--(BUSINESS WIRE)--Teledyne e2v Semiconductors today announced new radiation test results for its EV10AS940, a 10-bit, 12.8 GSps, Ka-band-capable analog-to-digital converter, or ADC, developed for demanding space payloads and mission-critical applications. These results give space engineers additional confidence when designing high-performance satellite communications payloads, synthetic aperture radar, or SAR, systems, space electronic intelligence platforms and advanced space...
-
Samenvatting: 90% van de IT-leiders zien hiaten in paraatheid voor AI-dreigingen, Lenovo zorgt voor één enkel verantwoordingspunt voor cyberweerbaarheid
MORRISVILLE, N.C.--(BUSINESS WIRE)--Naarmate organisaties de toepassing van AI en de transformatie van de digitale werkplek versnellen, stellen velen vast dat cyberveerkracht niet door gebrek aan beveiligingstools wordt ondermijnd, maar door de toenemende operationele complexiteit en de verfijning van bedreigingen. Volgens recent onderzoek bevestigt 90% van de IT-leiders dat er hiaten zijn in hun vermogen om zich tegen bedreigingen aangestuurd door AI te verdedigen. Deze bekendmaking is officie...
-
90% dos líderes de TI veem lacunas na preparação para ameaças de IA. Lenovo traz um ponto único de responsabilidade para a resiliência cibernética
MORRISVILLE, N.C.--(BUSINESS WIRE)--À medida que as organizações aceleram a adoção de IA e a transformação digital do ambiente de trabalho, muitas descobrem que a resiliência cibernética é prejudicada não pela falta de ferramentas de segurança, mas pela crescente complexidade operacional e sofisticação das ameaças. De acordo com pesquisas recentes, 90% dos líderes de TI reconhecem lacunas em sua capacidade de se defender contra ameaças impulsionadas por IA. Embora os investimentos em segurança...
-
Pershing Square Holdings, Ltd. UK Regulatory Announcement: Transaction in Own Shares
LONDON--(BUSINESS WIRE)-- Pershing Square Holdings, Ltd. Announces Transactions in Own Shares - 30 June 2026 Pershing Square Holdings, Ltd. (LN:PSH) (LN:PSHD) (“PSH”) today announced that it has purchased, through PSH’s agent, Jefferies International Limited (“Jefferies”), the following number of PSH’s Public Shares of no par value (ISIN Code: GG00BPFJTF46) (the "Shares"): Total Buyback Ticker/s: PSH (LSE); PSHD (LSE) Date of Purchase: 30 June 2026 Number of Public Shares Purchased: 32,631 S...
-
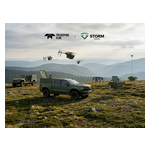
Teledyne FLIR Defense Partners With STORM to Extend Black Recon Missions Across More Vehicle Platforms
OSLO, Norway--(BUSINESS WIRE)--Teledyne FLIR Defense, part of Teledyne Technologies Incorporated (NYSE: TDY), and STORM have announced a partnership that will bring Teledyne FLIR’s Black Recon™ vehicle reconnaissance system to RADS™, the Rapid Adapt and Deploy System. As a RADS Application Partner, Teledyne FLIR gains a standardised route to field Black Recon across many more vehicle types, while joining STORM’s growing ecosystem of certified technology partners. The partnership was signed at E...