

Newsroom
Sorted by: Latest
-
Eddie Bauer LLC, Operator of US and Canadian Stores, Initiates Voluntary Chapter 11 Process With Support of Lenders
BELLEVUE, Wash.--(BUSINESS WIRE)--Eddie Bauer LLC (the “Retail Company”), operator of Eddie Bauer stores in the United States and Canada and a licensee of the Eddie Bauer brand, today announced that it has entered into a Restructuring Support Agreement (“RSA”) with the Retail Company’s secured lenders and commenced voluntary chapter 11 cases in the United States Bankruptcy Court for the District of New Jersey (the “Court”). The RSA is designed to enable the Retail Company to move through the ch...
-
Andrew Jefford Honoured With the Institute of Masters of Wine Lifetime Achievement Award
PARIS--(BUSINESS WIRE)--Journalist, poet and wine writer Andrew Jefford receives Lifetime Achievement Award from the Institute of Masters of Wine....

-
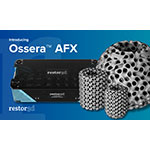
restor3d Announces Full Commercial Launch of Ossera™ AFX Ankle Fusion Cage System, Immediately Available in Both Standard and Made-to-Order Options
DURHAM, N.C.--(BUSINESS WIRE)--restor3d, a leader in 3D-printed, personalized orthopedic solutions, today announced the full commercial launch of the Ossera™ AFX Ankle Fusion Cage System, a comprehensive platform engineered to address complex ankle fusion cases and now available in both standard off-the-shelf and made-to-order configurations. Following a successful limited market release over the past several months, restor3d has expanded the Ossera™ AFX portfolio to include a standardized impl...
-
ZCG-Backed Unimed Acquires Regenboog Shipping Pharmacy
NEW YORK--(BUSINESS WIRE)--Universal Maritime Solutions (“Unimed” or “the Company”), a leading global provider of medical and compliance solutions to the maritime industry, today announced the acquisition of Regenboog Shipping Pharmacy, a Netherlands-based distributor of pharmaceutical products and medical devices serving the maritime sector. Unimed is backed by ZCG Private Equity, the private equity arm of Z Capital Group, LLC (“ZCG”), a privately held global firm. Based in Rotterdam, Regenboo...
-
Pernod Ricard : déclaration des droits de vote - janvier 2026
PARIS--(BUSINESS WIRE)--Regulatory News: Pernod Ricard (Paris:RI) : En application des articles 221-1 et 223-16 du Règlement Général de l'AMF, les émetteurs publient par communiqué et sur leur site Internet, le nombre total de droits de vote et le nombre d'actions composant le capital de la société s'ils ont varié par rapport à ceux publiés antérieurement : Situation au 31.01.2026 1) Nombre total d'actions en circulation composant le capital de la société : 252 269 195 2) Nombre total de droits...
-
TITAN confirme son leadership en durabilité avec son inclusion renouvelée dans la série d’indices FTSE4Good
BRUXELLES--(BUSINESS WIRE)--Regulatory News: Le Groupe TITAN (Brussels:TITC) confirme qu’il fait partie de la série d’indices FTSE4Good. Mise au point par le fournisseur international d’indices et de données FTSE Russell, la série d’indices FTSE4Good a été conçue pour mesurer la performance d’entreprises faisant preuve de solides pratiques environnementales, sociales et de gouvernance (ESG). Un large éventail d’acteurs du marché se servent des indices FTSE4Good pour élaborer et évaluer des fond...

-
TITAN’s Renewed FTSE4Good Index Series Inclusion Confirms Continued Sustainability Leadership
BRUSSELS--(BUSINESS WIRE)--Regulatory News: TITAN Group (Brussels:TITC) announces it has been included in the FTSE4Good Index Series. Created by the global index and data provider FTSE Russell, the FTSE4Good Index Series is designed to measure the performance of companies demonstrating strong Environmental, Social and Governance (ESG) practices. The FTSE4Good indexes are used by a wide variety of market participants to create and assess responsible investment funds and other products. FTSE Russ...
-
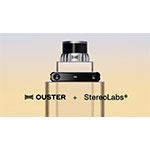
Ouster Acquires StereoLabs, Creating a World-Leading Physical AI Sensing and Perception Company
SAN FRANCISCO--(BUSINESS WIRE)--Ouster, Inc. (Nasdaq: OUST) (“Ouster” or the “Company”), a leader in sensing and perception for Physical AI, announced today that on February 4, 2026 it closed the acquisition of StereoLabs SAS (“StereoLabs”), a pioneer in AI vision and perception solutions. With this acquisition, Ouster now offers Physical AI's first unified sensing and perception platform, combining high-performance digital lidar, cameras, AI compute, sensor fusion and perception software, and...
-
Ouster acquiert StereoLabs et crée un leader mondial de la détection et de la perception pour Physical AI
SAN FRANCISCO, Californie--(BUSINESS WIRE)--Ouster, Inc. (Nasdaq : OUST) (« Ouster » ou la « Société »), acteur de référence de la détection et de la perception pour Physical AI, annonce aujourd’hui avoir finalisé, le 4 février 2026, l’acquisition de StereoLabs SAS (« StereoLabs »), pionnier des solutions de vision et de perception par IA. Grâce à cette acquisition, Ouster propose désormais la première plateforme unifiée de détection et de perception pour Physical AI, alliant lidar digital haut...

-
Marathon Asset Management Ltd UK Regulatory Announcement: Form 8.3
LONDON--(BUSINESS WIRE)-- FORM 8.3 PUBLIC OPENING POSITION DISCLOSURE/DEALING DISCLOSURE BY A PERSON WITH INTERESTS IN RELEVANT SECURITIES REPRESENTING 1% OR MORE Rule 8.3 of the Takeover Code (the “Code”) 1. KEY INFORMATION (a) Full name of discloser: Marathon Asset Management Limited (b) Owner or controller of interests and short positions disclosed, if different from 1(a): The naming of nominee or vehicle companies is insufficient. For a trust, the trustee(s), settlor and beneficiaries must...