Newsroom
Sorted by: Latest
-
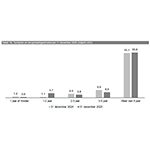
ICAPE: Consolidated Annual Revenue 2025
FONTENAY-AUX-ROSES, France--(BUSINESS WIRE)--Regulatory News: The ICAPE Group (ISIN code: FR001400A3Q3 – ticker: ALICA), a global technology distributor of printed circuit boards ("PCBs") and custom electromechanical components, today announces its annual consolidated revenue for 2025. Yann DUIGOU, Chief Executive Officer of ICAPE Group, states : “The performance in the 4th quarter of 2025 confirms the gradual recovery observed throughout the past year. As a result, the year as a whole shows do...

-
ICAPE : Chiffre d’affaires consolidé annuel 2025
FONTENAY-AUX-ROSES, France--(BUSINESS WIRE)--Regulatory News: Le Groupe ICAPE (code ISIN : FR001400A3Q3 – mnémonique : ALICA), distributeur technologique mondial de cartes de circuits imprimés (« PCB ») et de pièces électromécaniques à façon, annonce aujourd’hui son chiffre d’affaires consolidé pour l’exercice 2025. Yann DUIGOU, Directeur Général du Groupe ICAPE, déclare : « Les performances du 4ème trimestre 2025 confirment la reprise graduelle constatée tout au long de l’exercice écoulé. Ains...
-
Transfert effectif des titres FORSEE POWER sur Euronext Growth® Paris et radiation de leur cotation sur le marché réglementé d’Euronext Paris
PARIS--(BUSINESS WIRE)--Regulatory News: Forsee Power (FR0014005SB3 – FORSE), l’expert des systèmes de batteries intelligents pour véhicules électriques commerciaux et industriels, annonce aujourd’hui que le transfert effectif de la cotation de ses actions sur le marché Euronext Growth Paris aura lieu 16 février 2026. La demande d’admission des titres de la Société sur le marché Euronext Growth Paris a été approuvée par le Comité des Admissions d’Euronext le 11 février 2026. Comme indiqué dans...
-
Effective Transfer of FORSEE POWER Shares to Euronext Growth® Paris and Delisting From the Euronext Paris Regulated Market
PARIS--(BUSINESS WIRE)--Regulatory News: Forsee Power (FR0014005SB3 – FORSE), an expert in smart battery systems for commercial and industrial electric vehicles, today announces that the effective transfer of the listing of its shares to the Euronext Growth Paris market will take place on February 16, 2026. The admission of the Company’s shares to trading on Euronext Growth Paris was approved by the Euronext Admissions Committee on February 11, 2026. As indicated in previous press releases, thi...
-
Legrand : Modalités de mise à disposition des comptes consolidés au 31 décembre 2025
LIMOGES, France--(BUSINESS WIRE)--Regulatory News: Legrand (Paris:LR): Les comptes consolidés de 2025 arrêtés par le Conseil d’administration du 11 février 20261, la présentation et la conférence téléphonique (en direct et en différé) des résultats annuels 2025 sont accessibles sur le site de Legrand (www.legrand.com). Agenda financier : Résultats du premier trimestre 2026 : 7 mai 2026 Début de la « quiet period2 » : 7 avril 2026 Assemblée Générale des actionnaires : 27 mai 2026 Détachement du...
-
Release of Legrand’s Consolidated Financial Statements as of December 31, 2025
LIMOGES, France--(BUSINESS WIRE)--Regulatory News: Legrand (Paris:LR): Consolidated financial statements for 2025 were adopted by the Board of Directors at its meeting on February 11, 20261. These consolidated financial statements, a presentation of full-year results for 2025, and the related teleconference (live and replay) are available at www.legrandgroup.com. Key financial dates 2026 first-quarter results: : May 7, 2026 “Quiet period2” starts : April 7, 2026 General Meeting of Shareholders...
-
Legrand: 2025 Full-Year Results
LIMOGES, France--(BUSINESS WIRE)--Regulatory News: Legrand (Paris:LR): Benoît Coquart, Legrand’s Chief Executive Officer, commented: “In 2025, the first year of our 2030 strategic plan, the Group delivered a remarkable performance despite a still muted building market, with organic sales growth of +7.7%, growth from acquisitions of +5.1%, an adjusted operating margin of 20.7% after acquisitions, free cash flow of €1.3 billion and an achievement rate of 110% for our CSR roadmap. Beyond these exc...
-
Legrand : Publication annuelle 2025
LIMOGES, France--(BUSINESS WIRE)--Regulatory News: Legrand (Paris:LR): Benoît Coquart, Directeur général de Legrand, a déclaré : « Sur l’année 2025, première année de notre plan stratégique 2030, la performance du Groupe est remarquable en dépit d’un marché du bâtiment qui reste en retrait, avec une croissance organique du chiffre d’affaires de +7,7%, une croissance par acquisition de +5,1%, une marge opérationnelle ajustée de 20,7% après acquisitions, un cash flow libre de 1,3 milliard d’euros...
-
Mercedes-Benz Group AG: Solid Cash Generation and Shareholder Returns in 2025 as Product Launch Campaign Gains Traction
STUTTGART, Germany--(BUSINESS WIRE)--Mercedes-Benz Group AG: Solid cash generation and shareholder returns in 2025 as product launch campaign gains traction...

-
AB InBev publiceert de resultaten voor het vierde kwartaal en het volledige jaar 2025
BRUSSEL--(BUSINESS WIRE)--Anheuser-Busch InBev (Brussel:ABI) (BMV:ANB) (JSE:ANH) (NYSE:BUD): Gereglementeerde informatie / Voorkennis1 “Bier speelt een belangrijke rol in het samenbrengen van mensen en het creëren van momenten om te vieren. In 2025 voerden we onze strategie uit, maakten we gedisciplineerde keuzes op het gebied van kapitaaltoewijzing en kenden we een groei in lijn met onze vooruitzichten voor het jaar, ondanks een dynamische consumentenomgeving. We sluiten 2025 af met een verbet...