

Newsroom
Sorted by: Latest
-
Morgan Stanley Wealth Management Reduces Fees on Private Shares Marketplace EquityZen, Broadening Private Markets Access
NEW YORK--(BUSINESS WIRE)--Morgan Stanley Wealth Management today announced that EquityZen, a leading private shares platform it acquired in January 2026, is immediately lowering transaction fees for both investors and shareholders on its marketplace. With Morgan Stanley’s expansive private markets ecosystem, EquityZen clients benefit from the scale gained from the acquisition. “The strategic acquisition of EquityZen was about bringing a comprehensive end-to-end solution to our clients,” said J...
-
Celanese Opens Expanded Michigan Technology Center to Accelerate Customer Innovation and Strengthen North American Engineered Materials Development
DALLAS & TROY, Mich.--(BUSINESS WIRE)--Celanese Opens Expanded Michigan Technology Center to Accelerate Customer Innovation and Strengthen North American Engineered Materials Development...

-
Xtrackers by DWS Launches Europe Defense Technologies ETF
NEW YORK--(BUSINESS WIRE)--DWS, a leading European asset manager with global reach, today announced the launch of the Xtrackers Europe Defense Technologies ETF (Nasdaq: XDEF) (the “Fund”). The Fund seeks investment results that correspond generally to the performance, before fees and expenses, of the STOXX Europe Total Market Defence Space and Cybersecurity Innovation 50-25 Index (“the Index”). The index tracks the performance of European listed equities whose revenues or patent activities are...
-
SullivanCotter Welcomes Devin Paullin as Senior Vice President of Strategic Business Partners
CHICAGO--(BUSINESS WIRE)--SullivanCotter Welcomes Devin Paullin as Senior Vice President of Strategic Business Partners...
-
Orbia Honored as a Top Company in its Industry in the S&P Global Sustainability Yearbook for Fifth Consecutive Year
BOSTON--(BUSINESS WIRE)--Orbia Advance Corporation, S.A.B. de C.V. (BMV: ORBIA*), has been named a member of the S&P Global Sustainability Yearbook for the fifth consecutive year, which honors best-in-class global sustainability companies evaluated through the S&P Global Corporate Sustainability Assessment (CSA). “Orbia’s continued inclusion in this leading sustainability ranking underscores our conviction that sustainability is a driver of long‑term value creation,” said Tania Rabasa K...

-
Andersen Consulting Broadens Built-Asset Advisory Through Collaboration with Grinity
SAN FRANCISCO--(BUSINESS WIRE)--Andersen Consulting has entered into a Collaboration Agreement with Grinity....
-
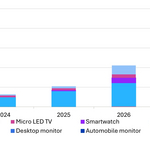
オムディア:ニアアイ・スマートウォッチとパブリックディスプレイ用途が牽引し、マイクロLEDディスプレイの売上高が2026年には1億500万ドルに倍増へ
ロンドン--(BUSINESS WIRE)--(ビジネスワイヤ) -- OmdiaのMicro LED Display Market Trackerによると、マイクロLEDディスプレイの売上高は前年比100%増が見込まれており、2025年の5,240万ドルから2026年には1億540万ドルに増加すると予測されています。パブリックディスプレイ、超大型テレビ、スマートウォッチ、スマートグラス向けマイクロLEDディスプレイの用途は依然として限定的であるものの、製造技術の急速な発達と新製品への採用拡大により、近い将来に出荷台数と売上高の大幅な成長が見込まれています。 これまで、大規模な商業化には大きな障壁が存在していました。具体的には、電気光学特性のばらつき、バルク転送技術の限界、バックプレーンの歩留まりの課題、そして最も重要な点として製造コストの高さが挙げられます。これらの課題に対処した結果、ディスプレイメーカーは現在、マイクロLEDテレビ、パブリックディスプレイ、スマートウォッチの量産を開始しています。 既存のディスプレイメーカーが参入困難だった分野であるLEDoS(シリコン上のマイクロ...
-
First Trust Global Funds PLC UK Regulatory Announcement: Net Asset Value(s)
LONDON--(BUSINESS WIRE)-- Funds Date TIDM ISIN Code Shares in Issue Currency Net Asset Value NAV/per Share First Trust Indxx Innovative Transaction & Process UCITS ETF 18.02.2026 LEGR LN IE00BF5DXP42 1,025,002.00 USD 51,693,366.34 50.433 ...
-
First Trust Global Funds PLC UK Regulatory Announcement: Net Asset Value(s)
LONDON--(BUSINESS WIRE)-- Funds Date TIDM ISIN Code Shares in Issue Currency Net Asset Value NAV/per Share First Trust NASDAQ Clean Edge Green Energy UCITS ETF 18.02.2026 QCLN.LN IE00BDBRT036 625,002.00 USD 12,298,226.57 19.677 ...
-
Deutsche Bank AG UK Regulatory Announcement: Buy-Back of Securities
LONDON--(BUSINESS WIRE)-- DB ETC plc COMPANY ANNOUNCEMENT Immediate Release 18 February 2026 Xtrackers Physical Gold ETC (EUR) (Incorporated and registered in Jersey under the Companies (Jersey) Law 1991 (as amended) with registered number 103781) Re: Buy-Back of ETC Securities Announcement The Issuer has agreed to buy back the ETC Securities for the following Series as set out in the table below. Series Number of Securities to be bought back Trade Date Settlement Date ISIN Series 04 - Xtracke...