

Newsroom
Sorted by: Latest
-
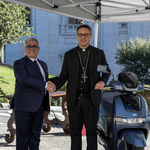
TVS Motor Delivers Two iQubes to the Governorate of Vatican City State
ROME--(BUSINESS WIRE)--TVS Motor delivers two iQubes to the Governorate of Vatican City State....
-
LTIMindtree Introduces New Brand Identity and Positioning: LTM — The Business Creativity Partner
MUMBAI, India--(BUSINESS WIRE)--LTIMindtree Introduces New Brand Identity and Positioning: LTM — The Business Creativity Partner....
-
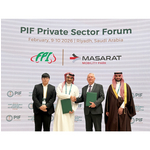
マサラット・モビリティパーク、先進的な自動車部品製造のアンカーテナントとしてFPI Gulfを迎え入れ
サウジアラビア、リヤド--(BUSINESS WIRE)--(ビジネスワイヤ) -- マサラット・モビリティパークは、PIF民間セクターフォーラム2026において、タイを拠点とするFPI Groupと現地パートナーであるFuel Autoparts Companyの合弁会社、Fortune Parts Industry Gulf(FPI Gulf)との開発リース契約締結を発表しました。本マイルストーンは、同パークの開発における重要な一歩であり、サウジ・ビジョン2030に沿ったサウジアラビア王国での自動車製造の現地化を後押しするものです。 この契約を受けて、世界的な自動車製造サービス企業であるFPI Gulfは、キング・アブドラ・エコノミック・シティ(KAEC)内のキング・サルマン自動車クラスターに位置するマサラット・モビリティパークで自動車部品工場を設立する予定です。これにより、サウジアラビアの自動車およびモビリティ産業の主要拠点としての同パークの地位の強化につながります。 同施設では、プラスチック射出成形、クロムめっき、塗装技術を用いた自動車部品の製造および流通を専門とします。同施...

-
Vonage und C3 AI kooperieren bei einer netzwerkfähigen, agentenbasierten KI-Lösung für den Außendienst für mobile Mitarbeiter
HOLMDEL, N.J.--(BUSINESS WIRE)--Vonage, ein Unternehmen von Ericsson (NASDAQ: ERIC), gab heute eine strategische Zusammenarbeit mit C3 AI (NYSE: AI) bekannt, einem führenden Anbieter von KI-Anwendungssoftware für Unternehmen, um C3 AI Field Services auf den Markt zu bringen, ein Modul der C3 AI Asset Performance Suite, das in die Vonage-APIs integriert ist. Das AI-First-Modul kombiniert die leistungsstarken Enterprise-AI-Funktionen von C3 AI mit den hochmodernen Kommunikations-APIs (Sprache und...
-
NATIXIS UK Regulatory Announcement: Form 8.3
LONDON--(BUSINESS WIRE)-- FORM 8.3 PUBLIC OPENING POSITION DISCLOSURE/DEALING DISCLOSURE BY A PERSON WITH INTERESTS IN RELEVANT SECURITIES REPRESENTING 1% OR MORE Rule 8.3 of the Takeover Code (the “Code”) 1. KEY INFORMATION (a) Full name of discloser: NATIXIS SA (b) Owner or controller of interests and short positions disclosed, if different from 1(a): The naming of nominee or vehicle companies is insufficient. For a trust, the trustee(s), settlor and beneficiaries must be named. (c) Name o...
-
Accord Financial finalise la vente de BondIt Media Capital
TORONTO--(BUSINESS WIRE)--Accord Financial Corp. (TSX – ACD) (« Accord » ou la « Société ») a annoncé aujourd’hui la vente de sa participation de 60 % dans BondIt Media Capital (« BondIt »). Cette vente constitue une étape importante du plan de la Société visant à céder ses actifs non stratégiques, à refinancer sa dette et à recentrer ses activités sur le Canada. Le produit brut de la transaction s'élève à 8,9 millions de dollars canadiens (6,6 millions de dollars américains), dont 6,8 millions...

-
Womble Bond Dickinson Energy Outlook 2026: UK Energy Capacity Growth Lags Global Average Amid Rising Costs and Delays
LONDON--(BUSINESS WIRE)--The global energy sector is facing mounting pressure as accelerating demand collides with grid constraints, rising project costs, and shifting government policies, according to Womble Bond Dickinson’s Energy Outlook 2026. Based on insights from more than 650 senior leaders across energy companies, investors, service providers, and energy-intensive consumers worldwide, the research highlights the difficulty of delivering reliable energy to keep pace with the surging dema...
-
Vonage et C3 AI s’associent pour proposer une solution d’IA agentique en réseau pour les services sur le terrain destinée aux travailleurs mobiles
HOLMDEL, New Jersey--(BUSINESS WIRE)--Vonage, filiale d’Ericsson (NASDAQ : ERIC), a annoncé aujourd’hui une collaboration stratégique avec C3 AI (NYSE : AI), l’un des principaux fournisseurs de logiciels d’application d’IA pour les entreprises, afin de lancer C3 AI Field Services, un module de la suite de produits C3 AI Asset Performance, intégré aux API de Vonage. Ce module axé sur l’IA combine les puissantes capacités d’IA d’entreprise de C3 AI avec les API de communication (voix et vidéo) et...

-
MASARAT Mobility Park歡迎FPI Gulf成為核心租戶,建設頂級汽車零組件製造基地
沙烏地阿拉伯利雅德--(BUSINESS WIRE)--(美國商業資訊)-- 在2026年沙烏地阿拉伯公共投資基金(PIF)私人部門論壇上,MASARAT Mobility Park宣布與Fortune Parts Industry Gulf (FPI Gulf)簽署開發租賃協議。FPI Gulf是泰國FPI Group和當地合作夥伴Fuel Autoparts Company共同成立的合資企業。這一里程碑代表產業園發展邁出了重要一步,同時支援沙烏地阿拉伯汽車製造業在地化,符合「沙烏地阿拉伯2030願景」。 根據協議,全球首屈一指的汽車製造服務商FPI Gulf將在阿卜杜拉國王經濟城(KAEC)薩勒曼國王汽車產業群集內的MASARAT Mobility Park建設一座汽車零組件工廠,進一步鞏固該產業園沙烏地阿拉伯汽車和行動運輸產業核心集聚地的地位。 該工廠將專注於運用注塑、鍍鉻和塗裝技術生產和銷售汽車零組件,為本地和國際整車製造商(OEM)提供配套服務,協助強化沙烏地阿拉伯汽車供應鏈體系。 MASARAT Mobility Park執行長Tienie Ferreira在評論此次公告時...
-
MASARAT Mobility Park引进FPI Gulf作为核心租户,建设高端汽车零部件制造基地
沙特利雅得--(BUSINESS WIRE)--(美国商业资讯)-- 在2026年沙特公共投资基金(PIF)私营部门论坛上,MASARAT Mobility Park宣布与Fortune Parts Industry Gulf (FPI Gulf)签署开发租赁协议。FPI Gulf是泰国FPI Group和当地合作伙伴Fuel Autoparts Company共同成立的合资企业。这一里程碑标志着产业园发展迈出了重要一步,同时支持沙特汽车制造业本土化,符合“沙特2030愿景”。 根据协议,全球领先的汽车制造服务商FPI Gulf将在阿卜杜拉国王经济城(KAEC)萨勒曼国王汽车产业集群内的MASARAT Mobility Park建设一座汽车零部件工厂,进一步巩固该产业园作为沙特汽车和移动出行产业核心集聚地的地位。 该工厂将专注于运用注塑、镀铬和涂装技术生产和销售汽车零部件,为本地和国际整车制造商(OEM)提供配套服务,助力强化沙特汽车供应链体系。 MASARAT Mobility Park首席执行官Tienie Ferreira在评论此次公告时表示:“本协议凸显了MASARAT Mob...
