

Newsroom
Sorted by: Latest
-
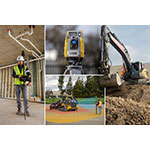
Topcon Unveils New Machine Control, Safety, and Geomatics Innovations at CONEXPO 2026
LAS VEGAS--(BUSINESS WIRE)--Topcon Positioning Systems has announced new 3D machine control technologies, functionalities, and safety features for earthmoving and paving applications, as well as geomatic technologies for surveying and building construction applications. By connecting equipment, people, and processes, the new technologies are designed to increase productivity across applications and project phases through a centralized platform approach. The announcement was made for CONEXPO-CON...
-
SBC Medical nomeia Sheng-FU Hsiao como diretor de tecnologia (CTO) Aproveitando o big data médico de 283 locais globais e 6,63 milhões de consultas anuais para construir uma infraestrutura de gestão médica escalável e impulsionada por IA
IRVINE, Califórnia--(BUSINESS WIRE)--A SBC Medical Group Holdings Incorporated (Nasdaq: SBC) (“SBC Medical” ou a “Empresa”), fornecedora global de serviços abrangentes de consultoria e gestão para empresas médicas e suas clínicas, anunciou hoje a nomeação de Sheng-FU Hsiao como diretor de Tecnologia (CTO), a partir de 1º de março de 2026. Esta nomeação está alinhada com a estratégia de gestão da Empresa para 2026, “Sofisticação da estrutura de gestão através da IA e DX”, e reforça a sua equipa...

-
Yubicoがシンガポールに世界で3つ目となるAPAC本部が設立アジア太平洋地域での成長を加速
シンガポール発--(BUSINESS WIRE)--(ビジネスワイヤ) -- ハードウェア認証セキュリティの世界的リーダーYubicoは(ナスダック・ストックホルム:YUBICO)は本日、シンガポールに世界で3つ目となる本社機能を持つ拠点を開設することを発表しました。本発表は、Yubicoのアジア太平洋地域への長期的なコミットメントを改めて示すとともに、オープン認証規格の推進における同社の役割をさらに強化し、すべての人にとってより安全なデジタル世界の実現に向けた取り組みを加速するものです。 新オフィスは、スウェーデン・ストックホルムおよび米国サンタクララに置く既存のグローバル本社を補完するものであり、急速に進化するサイバーセキュリティ環境に対応すべく顧客が大規模にYubiKeyを導入できるよう支援することで、拡大する国際的なユーザーベースに対応するという同社の戦略を反映しています。 「デジタル経済の成長に伴い、アジア太平洋地域全体で大きな変化が起きています。各組織は、アイデンティティ保護に関する厳格で新たな国家規制に対応するため、従来の多要素認証からの脱却を進めています」と、シンガポ...
-
Yubico Establishes Singapore as Third Global Headquarters Accelerating Asia Pacific Growth
SINGAPORE--(BUSINESS WIRE)--Yubico (NASDAQ STOCKHOLM: YUBICO), a cybersecurity company, inventor of FIDO passkeys and creator of the YubiKey, the most secure passkey, today announced the opening of its third global headquarters in Singapore. This announcement reinforces Yubico’s long-term commitment to the Asia Pacific region and builds on its role in advancing open authentication standards, while shaping a safer digital world for all. The new office complements Yubico’s existing global headqua...
-
Yubico Establishes Singapore as Third Global Headquarters Accelerating Asia Pacific Growth
SINGAPORE--(BUSINESS WIRE)--Regulatory News: Yubico (NASDAQ STOCKHOLM: YUBICO), a cybersecurity company, inventor of FIDO passkeys and creator of the YubiKey, the most secure passkey, today announced the opening of its third global headquarters in Singapore. This announcement reinforces Yubico’s long-term commitment to the Asia Pacific region and builds on its role in advancing open authentication standards, while shaping a safer digital world for all. The new office complements Yubico’s existi...
-
MWC 2026: Rakuten Cloud-Native Storage Now Built into Google Distributed Cloud Connected Servers
TOKYO--(BUSINESS WIRE)--Rakuten Symphony, Inc. today announced that Rakuten Cloud-Native Storage is now built into Google Distributed Cloud Connected Servers, making Rakuten’s software-defined storage a standard, pre-integrated component of Google Distributed Cloud Connected Server deployment. “This milestone marks a deepening of the collaboration between Rakuten Symphony and Google Cloud and reflects a shared commitment to simplifying distributed edge cloud deployments for enterprises,” said P...
-
Armanino Adds MSTiller, a Premier Southeast Accounting Firm, Strengthening Presence in High-Growth Region
SAN RAMON, Calif.--(BUSINESS WIRE)--Armanino welcomes MSTiller, expanding its Southeast presence with experienced talent to better serve clients in complex markets....
-
NUBURU e Maddox Defense creano una joint venture transatlantica per la produzione nel settore della difesa
DENVER--(BUSINESS WIRE)--NUBURU, Inc. (NYSE American: BURU), società con piattaforma Defense & Security (difesa e sicurezza) a duplice uso incentrata su effetti non cinetici, tecnologie di energia diretta e sistemi di difesa orchestrati da software, oggi ha annunciato di aver stipulato, attraverso la sua azienda interamente controllata Nuburu Defense LLC (“Nuburu Defense”), un Accordo contrattuale di joint venture vincolante (l'“Accordo”) con Maddox Defense Incorporated (“Maddox Defense”) p...
-
Bron Launches Digital Inheritance Feature for Self-Custody Wallets, Solving One of Crypto’s Most Overlooked Risks
CAYMAN ISLANDS--(BUSINESS WIRE)--Bron, the world’s first non-custodial wallet combining institutional-grade security with seamless recovery, today announced the launch of its Digital Inheritance feature. The feature addresses one of crypto’s most persistent and unresolved challenges: what happens to digital assets when their owner dies. As early crypto adopters age and digital assets become part of mainstream wealth planning, inheritance has emerged as a critical gap in self-custody. Blockchain...
-
B&G Foods Declares Regular Quarterly Dividend
PARSIPPANY, N.J.--(BUSINESS WIRE)--B&G Foods, Inc. (NYSE: BGS) announced today that its Board of Directors has declared a regular quarterly cash dividend of $0.19 per share of common stock. The dividend is payable on April 30, 2026 to stockholders of record as of March 31, 2026. At the closing market price of the common stock on March 2, 2026, the current dividend rate represents an annualized yield of 14.7%. This is the 86th consecutive quarterly dividend declared by the Board of Directors...