

Newsroom
Sorted by: Latest
-
Resumen: Medina celebra el tercer Foro de Umrah y Ziyarah con una fuerte participación internacional
MEDINA, Arabia Saudí--(BUSINESS WIRE)--La tercera edición del Foro de Umrah y Ziyarah comenzará el lunes 30 de marzo de 2026 en Medina. El Ministerio de Hajj y Umrah está a cargo de la organización del foro en el Centro Internacional de Convenciones Rey Salman, en alianza con el Programa de Experiencia de Peregrinos y con amplia participación de líderes de negocios, responsables de toma de decisiones y especialistas en el ecosistema de servicios de Umrah y Ziyarah de todo el mundo, con el objet...

-
Riassunto: Medina ospita il terzo Forum sull’Umrah e sulla Ziyarah con una forte partecipazione internazionale
MEDINA, Arabia Saudita--(BUSINESS WIRE)--La terza edizione del Forum sull’Umrah e sulla Ziyarah avrà inizio a Medina lunedì 30 marzo 2026. L’evento è organizzato dal Ministero dell’Hajj e dell’Umrah, in collaborazione con il programma per l’esperienza del pellegrino (Pilgrim Experience Program), presso il King Salman International Convention Center; vedrà l’ampia partecipazione di leader del settore, responsabili delle decisioni e specialisti dell’ecosistema dei servizi per l’Umrah e la Ziyarah...

-
Samenvatting: Medina organiseert derde Umrah- en Ziyarah-forum met grote internationale opkomst
MADINAH, Saoedi-Arabië--(BUSINESS WIRE)--De derde editie van het Umrah- en Ziyarah-forum gaat op maandag 30 maart 2026 van start in Medina. Organisators zijn het Ministerie van Hadj en Umrah, in samenwerking met het Pilgrim Experience Program. Het forum vindt plaats in het King Salman International Convention Center. Een groot aantal bedrijfsleiders, besluitvormers en specialisten uit het ecosysteem van Umrah- en Ziyarah-diensten van over de hele wereld zullen hier aanwezig zijn om expertise ui...
-
Medina ist Gastgeber des dritten Umrah & Ziyarah Forums mit starker internationaler Beteiligung
MEDINA, Saudi-Arabien--(BUSINESS WIRE)--Die dritte Ausgabe des Umrah & Ziyarah Forums in Medina wird am Montag, dem 30. März 2026 beginnen. Das Forum wird vom Ministerium für Hajj und Umrah in Partnerschaft mit dem Pilgrim Experience Program im King Salman International Convention Center unter breiter Beteiligung von Wirtschaftsführern, Entscheidungsträgern und Spezialisten des Umrah & Ziyarah Ökosystems aus aller Welt organisiert, um Fachwissen auszutauschen und Wege zur weiteren Berei...

-
Riassunto: Helical Fusion annuncia il sito scelto per la realizzazione della fase 1 di "Helix HARUKA" e dà il via alla produzione e all'assemblaggio di hardware per la fusione
TOKYO--(BUSINESS WIRE)--Helical Fusion Co., Ltd. (sede: Chuo-ku, Tokyo; CEO: Takaya Taguchi; "Helical Fusion"), società nipponica attiva nel settore dell'energia da fusione che promuove il programma Helix e impegnata nello sviluppo dello stellarator Helical per le centrali elettriche commerciali a fusione nucleare, ha annunciato il sito in cui sarà attuata la fase 1 di Helix HARUKA, il suo dispositivo integrato dimostrativo. La fase 1, quella di dimostrazione del magnete, sarà attuata in uno sp...

-
Resumen: Helical Fusion anuncia la construcción del sitio para la fase 1 de “Helix HARUKA”, en lo que representa una transición hacia la fabricación y el ensamblado de hardware de fusión
TOKIO--(BUSINESS WIRE)--Helical Fusion Co., Ltd. (oficinas centrales: Chuo-ku, Tokio; director general: Takaya Taguchi; “Helical Fusion”), una empresa de energía de fusión japonesa que impulsa el programa Helix y desarrolla el estelarátor helicoidal para plantas de energía de fusión comerciales, anunció el sitio de construcción para la fase 1 de Helix HARUKA, su dispositivo de demostración integrado. La fase 1, que consiste en la demostración magnética, se construirá en un espacio exclusivo par...

-
Samenvatting: Helical Fusion maakt de bouwlocatie bekend voor fase 1 van „Helix HARUKA“, waarmee de overgang naar de productie en assemblage van fusieapparatuur wordt ingeluid
TOKIO--(BUSINESS WIRE)--Helical Fusion Co., Ltd. (hoofdkantoor: Chuo-ku, Tokio; CEO: Takaya Taguchi; „Helical Fusion“), een Japans bedrijf op het gebied van fusie-energie dat het Helix-programma uitvoert en de Helical Stellarator voor commerciële fusiecentrales ontwikkelt, heeft de bouwlocatie bekendgemaakt voor fase 1 van Helix HARUKA, zijn geïntegreerde demonstratie-apparatuur. Fase 1 – de demonstratiefase van de magneet – wordt gerealiseerd in een speciale werkruimte voor de gezamenlijke ond...

-
Helical Fusion annonce le lancement des travaux de construction au niveau du site dédié à la phase 1 du projet « Helix HARUKA », marquant ainsi le passage à la fabrication et à l’assemblage du matériel de fusion
TOKYO--(BUSINESS WIRE)--Helical Fusion Co., Ltd. (siège social : Chuo-ku, Tokyo ; PDG : Takaya Taguchi ; « Helical Fusion »), une entreprise japonaise spécialisée dans l’énergie de fusion qui mène le programme Helix et développe le stellarator Helical destiné aux centrales à fusion commerciales, a annoncé le lancement des travaux de construction au niveau du site dédié de la phase 1 d’Helix HARUKA, son dispositif de démonstration intégré. La phase 1 — la phase de démonstration de l’aimant — ser...

-
Helical Fusion gibt den Bauort für Phase 1 von „Helix HARUKA“ bekannt und markiert damit den Übergang zur Fertigung und Montage der Fusionskomponenten
TOKIO--(BUSINESS WIRE)--Helical Fusion Co., Ltd. (Hauptverwaltung: Chuo-ku, Tokio; CEO: Takaya Taguchi; „Helical Fusion“), ein japanisches Unternehmen im Bereich der Fusionsenergie, das das Helix-Programm vorantreibt und den Helical-Stellarator für kommerzielle Fusionskraftwerke entwickelt, gab den Bauort für Phase 1 von Helix HARUKA, seiner integrierten Demonstrationsanlage, bekannt. Phase 1 – die Magnetdemonstrationsphase – wird in einem eigens dafür vorgesehenen Arbeitsbereich für die gemein...
-
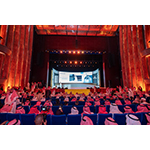
Riassunto: I tornei ufficiali del Campionato mondiale di Street Fighter 6 organizzati da Capcom hanno attirato un numero record di 20.000 partecipanti
OSAKA, Giappone--(BUSINESS WIRE)--Capcom Co., Ltd. (TOKYO:9697) ha annunciato oggi che la Capcom Cup 12 e la Street Fighter League: World Championship 2025, i tornei ufficiali mondiali volti a determinare i migliori giocatori di Street Fighter 6 che si sono svolti all'Arena Ryogoku Kokugikan dall'11 al 15 marzo, hanno registrato un record di 20.000 spettatori, concludendosi con grande successo. Alla Capcom Cup 12, che prevede incontri tra singoli giocatori, SAHARA (21 anni), al suo primo anno d...