Newsroom
Sorted by: Latest
-
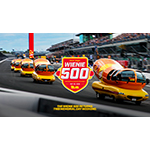
Oscar Mayer Wienie 500 Returns for its Second Year with a Sizzling New Twist
CHICAGO & PITTSBURGH--(BUSINESS WIRE)--The meatiest race in motorsports is officially back! Oscar Mayer today announced the second annual Wienie 500 will return to the iconic Indianapolis Motor Speedway on Friday, May 22 leading up to the 110th Indianapolis 500. Serving as the unofficial kickoff to summer with 72 million hot dogs consumed every Memorial Day Weekend, the Wienie 500 sets out to remind fans that anywhere is the perfect time for an Oscar Mayer Wiener—even a professional racetrack....
-
General Mills Expands Dec. 21, 2025, Voluntary Recall of Select Pillsbury Pizza Pops Products
TORONTO--(BUSINESS WIRE)--General Mills Expands Dec. 21, 2025, Voluntary Recall of Select Pillsbury Pizza Pops Products...
-
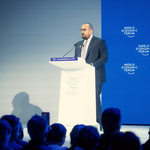
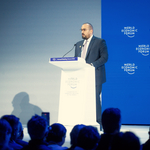
A HUMAIN és az Infra mesterséges intelligencia és digitális finanszírozási keretmegállapodást jelent be
DAVOS, Svájc--(BUSINESS WIRE)--A HUMAIN és a Nemzeti Infrastruktúra Alap („Infra”) a svájci Davosban megrendezett 2026-os Világgazdasági Fórum (WEF) éves ülésének alkalmából egy akár 1,2 milliárd dollárig terjedő stratégiai finanszírozási keretmegállapodást jelentett be a mesterséges intelligencia és a digitális infrastruktúra projektjeinek bővítésére Szaúd-Arábiában. A keretmegállapodás nem kötelező érvényű finanszírozási feltételeket vázol fel a HUMAIN legfeljebb 250 MW hiperskálájú mesterség...
-
A*STAR and Halliburton Launch NEX Lab℠ to Advance Well Completion Innovation
HOUSTON & SINGAPORE--(BUSINESS WIRE)--Halliburton (NYSE: HAL) and the Agency for Science, Technology and Research (A*STAR), Singapore’s lead public sector research and development (R&D) agency, announced the launch of the Next-Generation Energy Accelerators Joint Lab (NEX Lab℠). This initiative aims to accelerate the development and commercialization of advanced well completion technologies for the energy industry. The project is also supported by the Singapore Economic Development Board (E...
-
L’Arabia Saudita ospiterà il World Economic Forum Global Collaboration and Growth Meeting: “Building Common Ground and Reviving Growth”, il 22-23 aprile 2026
DAVOS, Svizzera--(BUSINESS WIRE)--È stato annunciato oggi, in occasione della giornata conclusiva della 56° edizione del World Economic Forum (WEF) a Davos, Svizzera, che l’Arabia Saudita ospiterà il World Economic Forum (WEF) Global Collaboration and Growth Meeting: “Building Common Ground and Reviving Growth, a Jeddah il 22 e 23 aprile 2026. Sua Eccellenza Faisal F. Alibrahim, Ministro dell’Economia e della Pianificazione dell’Arabia Saudita, ha confermato i dettagli di questo importante appu...

-
W dniach 22–23 kwietnia 2026 r. Arabia Saudyjska zorganizuje Globalne Spotkanie na rzecz Współpracy i Rozwoju w ramach Światowego Forum Ekonomicznego pod hasłem „Budowa wspólnych podstaw i ożywienie rozwoju”
DAVOS, Szwajcaria--(BUSINESS WIRE)--W komunikacie przekazanym ostatniego dnia 56. dorocznej konferencji Światowego Forum Ekonomicznego w Davos (Szwajcaria) poinformowano, że w dniach 22–23 kwietnia 2026 r. w Dżeddzie Arabia Saudyjska zorganizuje Globalne Spotkanie na rzecz Współpracy i Rozwoju w ramach Światowego Forum Ekonomicznego pod hasłem „Budowa wspólnych podstaw i ożywienie rozwoju”. Jego Ekscelencja Faisal F. Alibrahim, minister gospodarki i planowania Arabii Saudyjskiej, potwierdził dz...

-
Szaúd-Arábia ad otthont a 2026. április 22-23-án megrendezésre kerülő Világgazdasági Fórum (WEF) Globális Együttműködési és Növekedési Találkozó: Közös Alap Kiépítése és a Növekedés Újjáélesztése című rendezvénynek
DAVOS, Svájc--(BUSINESS WIRE)--Szaúd-Arábia ad otthont a Világgazdasági Fórum (WEF) Globális Együttműködési és Növekedési Találkozó: Közös Alap Kiépítése és a Növekedés Újjáélesztése című rendezvénynek Dzsiddában, 2026. április 22-23-án – jelentették be a Fórum 56. éves ülésének zárónapján a svájci Davosban. Őexcellenciája Faisal F. Alibrahim, Szaúd-Arábia gazdasági és tervezési minisztere a mai napon megerősítette a magas szintű WEF-találkozó részleteit, amely a 2025-ös WEF éves ülésén került...
-
L’Arabie saoudite accueillera la Réunion mondiale de collaboration et de croissance du Forum Économique Mondial : Bâtir un terrain d’entente et relancer la croissance les 22 et 23 avril 2026
DAVOS, Suisse--(BUSINESS WIRE)--L’Arabie saoudite accueillera la Réunion mondiale de collaboration et de croissance du Forum Économique Mondial (FEM) : Bâtir un terrain d’entente et relancer la croissance à Djeddah les 22 et 23 avril 2026, a-t-on annoncé lors de la clôture de la 56e Réunion annuelle du Forum à Davos, en Suisse. Son Excellence Fayçal F. Alibrahim, ministre de l’Économie et de la Planification d’Arabie saoudite, a confirmé aujourd’hui les détails de cette réunion régulière de hau...

-
Saoedi-Arabië organiseert ‘World Economic Forum Global Collaboration and Growth Meeting: Building Common Ground and Reviving Growth’ op 22-23 april 2026
DAVOS, Zwitserland--(BUSINESS WIRE)--Saoedi-Arabië zal op 22-23 april 2026 in Jeddah het ‘World Economic Forum (WEF) Global Collaboration and Growth Meeting: Building Common Ground and Reviving Growth’ organiseren. De aankondiging werd gedaan op de slotdag van de 56e Jaarvergadering van het Forum in Davos, Zwitserland. Zijne Excellentie Faisal F. Alibrahim, de Saoedische Minister van Economie en Planning, bevestigde vandaag de details van deze reguliere WEF-top op hoog niveau, die oorspronkelij...

-
Saúdská Arábie bude hostit setkání Světového ekonomického fóra o globální spolupráci a růstu: Budování společné základny a oživení růstu ve dnech 22. až 23. dubna 2026
DAVOS, Švýcarsko--(BUSINESS WIRE)--Saúdská Arábie bude hostit setkání Světového ekonomického fóra („World Economic Forum“, WEF) na téma Globální spolupráce a růst: Budování společné platformy a oživení růstu, které se bude konat ve dnech 22. až 23. dubna 2026 v Džiddě. Tato informace byla oznámena v závěrečný den 56. výročního zasedání fóra v Davosu ve Švýcarsku. Jeho Excelence Faisal F. Alibrahim, ministr hospodářství a plánování Saúdské Arábie, dnes potvrdil podrobnosti pravidelného setkání W...