

Newsroom
Sorted by: Latest
-
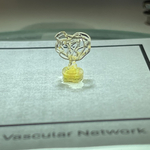
Starlab Space and Auxilium Biotechnologies to Advance Life Sciences Research in Microgravity
HOUSTON--(BUSINESS WIRE)--Starlab Space LLC, the commercial space station developer expanding access to low Earth orbit research, today announced a partnership with Auxilium Biotechnologies. This agreement represents a significant advancement in 3D bioprinting and biofabrication in orbit and underscores Starlab's commitment to growing scientific discovery beyond the limits of Earth. Auxilium will provide orbital 3D bioprinting and biofabrication capabilities aboard the Starlab space station to...
-
Essential Income REIT’s Net Asset Value Per Share Increases in Q4 2025
PASADENA, Calif.--(BUSINESS WIRE)--The Net Asset Value ("NAV") per share of the Essential Income REIT has increased to $27.46 per share, as of December 31, 2025....
-
Oldcastle BuildingEnvelope, Inc. Renews Strategic Partnership With AIA for 2026
DALLAS--(BUSINESS WIRE)--Oldcastle BuildingEnvelope, Inc. (OBE), a leading supplier of architectural glass, metal, and hardware, is proud to announce the renewal of its strategic partnership with the American Institute of Architects (AIA). Now in its eighth year, this collaboration reflects OBE’s pioneering commitment as the first building products manufacturer to establish a strategic partnership with the AIA. From the outset, OBE has focused on a proactive approach to supporting the industry,...
-
Soluna Begins Energization of Project Kati 1, adding 83 MWs to Total Capacity
ALBANY, New York--(BUSINESS WIRE)--Soluna Holdings, Inc. (“Soluna” or the “Company”) (NASDAQ: SLNH), a developer of green data centers for intensive computing applications, including Bitcoin mining and AI, today announced that it has received ERCOT approval to begin the initial energizing and phased commissioning of Project Kati 1 on schedule. Project Kati is Soluna’s 83 MW wind-powered data center campus in South Texas dedicated to Bitcoin mining. The energization will be split between Kati 1A...

-
Masonite International Corporation Sued for Securities Law Violations - Contact the DJS Law Group to Discuss Your Rights – DOOR
LOS ANGELES--(BUSINESS WIRE)--Masonite International Corporation Sued for Securities Law Violations - Contact the DJS Law Group to Discuss Your Rights – DOOR...
-
Bluespring Wealth Partners Welcomes $2.3 Billion SHP Financial
AUSTIN, Texas--(BUSINESS WIRE)--Bluespring Wealth Partners (Bluespring), a leading acquirer of RIAs and wealth management firms, today announced the acquisition of financial planning firm SHP Financial (SHP). A growth-oriented company that’s looking to expand on their past and current success, the SHP team is known for their disciplined approach to providing mass-affluent and high-net-worth clients with comprehensive financial planning services, grounded in a strong internal culture and a relat...
-
Evommune Announces Positive Top-line Data from Phase 2a Proof-of-Concept Trial of EVO301 in Moderate-to-Severe Atopic Dermatitis
PALO ALTO, Calif. & NEW YORK--(BUSINESS WIRE)--Evommune, Inc. (NYSE: EVMN) (the “Company” or “Evommune”), a clinical-stage biotechnology company developing innovative therapies that target key drivers of chronic inflammatory diseases, today announced positive top-line results from its randomized, double-blind, placebo-controlled Phase 2a trial evaluating EVO301. This long-acting fusion protein consisting of an interleukin-18 (IL-18) binding protein and an anti-serum albumin Fab-associated domai...

-
Qube Research & Technologies LTD UK Regulatory Announcement: Form 8.3
LONDON--(BUSINESS WIRE)-- FORM 8.3 PUBLIC OPENING POSITION DISCLOSURE/DEALING DISCLOSURE BY A PERSON WITH INTERESTS IN RELEVANT SECURITIES REPRESENTING 1% OR MORE Rule 8.3 of the Takeover Code (the “Code”) 1. KEY INFORMATION (a) Full name of discloser: Qube Research & Technologies Limited (b) Owner or controller of interests and short positions disclosed, if different from 1(a): The naming of nominee or vehicle companies is insufficient. For a trust, the trustee(s), settlor and beneficiari...
-
Hasbro and Warner Bros. Discovery Global Consumer Products Announce Multi-Year Partnership to Bring the “Harry Potter” Universe to Life Through Licensed Toys & Games
PAWTUCKET, R.I.--(BUSINESS WIRE)--Hasbro, a leading games, IP and toy company, today announced a new multi-year licensing partnership starting in 2027 with Warner Bros. Discovery Global Consumer Products (WBDGCP), making Hasbro the global primary toy licensee for the world of Harry Potter and the upcoming HBO Original HARRY POTTER series. Hasbro’s innovative team will bring the Harry Potter universe to life through a range of film and HBO Original series-inspired products featuring dolls, role...
-
Qube Research & Technologies LTD UK Regulatory Announcement: Form 8.3
LONDON--(BUSINESS WIRE)-- FORM 8.3 PUBLIC OPENING POSITION DISCLOSURE/DEALING DISCLOSURE BY A PERSON WITH INTERESTS IN RELEVANT SECURITIES REPRESENTING 1% OR MORE Rule 8.3 of the Takeover Code (the “Code”) 1. KEY INFORMATION (a) Full name of discloser: Qube Research & Technologies Limited (b) Owner or controller of interests and short positions disclosed, if different from 1(a): The naming of nominee or vehicle companies is insufficient. For a trust, the trustee(s), settlor and beneficiari...