

Newsroom
Sorted by: Latest
-
Samenvatting: Amazfit presenteert de Cheetah 2 Pro, een hoogwaardig hardloophorloge ontworpen om je klaar te maken voor de marathon
MILPITAS, Calif.--(BUSINESS WIRE)--Amazfit, een toonaangevend wereldwijd merk voor slimme wearables in eigendom van Zepp Health, heeft vandaag de Cheetah 2 Pro aangekondigd, de nieuwste toevoeging aan zijn op prestaties gerichte Cheetah-serie. De Cheetah 2 Pro is ontwikkeld voor marathonlopers die geloven dat voorbereiding alles is. Het legt de focus op een eenvoudig idee: marathonprestaties worden bepaald door het werk dat hardlopers gedurende de trainingsweek verrichten. Dit gerichte training...
-
Amazfit发布专为准备马拉松打造的成绩跑步手表Cheetah 2 Pro
加利福尼亚州米尔皮塔斯--(BUSINESS WIRE)--(美国商业资讯)-- Amazfit(Zepp Health旗下的领先全球智能可穿戴设备品牌)今天宣布推出Cheetah 2 Pro。这是该公司专注成绩的Cheetah系列的新成员,专为相信万事在于准备的马拉松跑者打造,围绕一个简单的信念而设计:马拉松成绩取决于跑者在训练周付出的努力。这款产品将结构化跑步、强度支持训练以及恢复洞察信息整合到一个有重点的准备系统中,通过长距离马拉松增量帮助跑者保持一致。Cheetah 2 Pro在波士顿和伦敦马拉松之前推出,专为满足高里程训练和竞赛日等需求打造。 Cheetah 2 Pro秉承Amazfit优化成绩和轻盈结构的理念,专为深知速度不仅在于里程和节奏,更在于能够长时间保持成绩的强度、恢复和纪律的跑者打造。这款产品以混合训练理念为出发点,可支持长距离马拉松增量训练所需的耐久性和一致性。 “马拉松训练设计在准备的每个环节保持一致性、纪律和有意识性。在我为准备波士顿马拉松训练过程中,Cheetah 2 Pro帮助我严格遵守从配速到恢复的各个细节,而且让我感觉轻松、舒适,真正是为满足高里程训...

-
NetApp s’associe à Google Cloud pour alimenter les infrastructures de données destinées au cloud distribué
SAN JOSE, Californie--(BUSINESS WIRE)--NetApp® (NASDAQ : NTAP), la société des infrastructures de données intelligentes, a annoncé aujourd’hui avoir renforcé sa collaboration avec Google Cloud en signant un contrat d’entreprise d’une durée de quatre ans visant à accélérer le déploiement des solutions de stockage de NetApp au sein du Google Distributed Cloud (GDC) sous air gap, la plateforme cloud souveraine de Google fournie par World Wide Technology (WWT). La plateforme de données NetApp intég...

-
Andersen Consulting新增合作公司Nuvolar
舊金山--(BUSINESS WIRE)--(美國商業資訊)-- Andersen Consulting透過與Nuvolar簽署合作協議擴大其數位化轉型平台。Nuvolar是一家技術顧問公司,專注於採用雲端架構的軟體發展和先進的Salesforce實施服務。 Nuvolar成立於2008年,總部位於西班牙,提供端對端數位產品開發服務,在Salesforce、客製化網頁和行動應用程式、全堆疊開發、使用者體驗/介面設計、產品管理和長期支援服務方面擁有深厚專業知識。該公司在巴塞隆納、馬德里、邁阿密和墨西哥市擁有超過110名專業人員,服務於航空、醫療保健、消費品、製藥和酒店業的客戶,設計並部署可擴充的關鍵業務平台,從而推動營運最佳化並加快數位化轉型。 Nuvolar執行長Marc Vivas表示:「與Andersen Consulting合作讓我們能夠更大規模地運用自身專業知識。身為一家注重工程技術的公司,我們期待攜手合作,為客戶提供創新、可靠和以使用者為中心的數位解決方案,支援永續成長和長期數位成熟度。」 Andersen全球董事長兼執行長Mark L. Vorsatz表示:「Nuvolar...
-
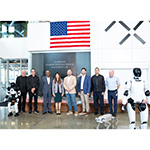
California State Treasurer Fiona Ma Visits Faraday Future’s Headquarters and Unveils EAI Robotics Education & Innovation Lab; FF EAI Ecosystem Strategy to Form a Closed Loop, Supporting California’s Ambition to Be the World’s Third-Largest Economy
LOS ANGELES--(BUSINESS WIRE)--Faraday Future Intelligent Electric Inc. (NASDAQ: FFAI) (“Faraday Future,” “FF,” or the “Company”), a California-based global Embodied AI (EAI) ecosystem company, today announced that California State Treasurer Fiona Ma visited FF's El Segundo headquarters on April 16, experiencing FF’s EAI robotics and EAI EVs firsthand and attending the unveiling of the FF EAI Robotics Education & Innovation Lab. El Segundo Mayor Chris Pimentel, Former California State Senato...
-
Andersen Consulting aggiunge l'azienda collaboratrice Nuvolar
SAN FRANCISCO--(BUSINESS WIRE)--Andersen Consulting espande la propria piattaforma di trasformazione digitale grazie a un accordo di collaborazione con Nuvolar, società di consulenza in ambito tecnologico specializzata nello sviluppo di software su base cloud e in implementazioni di Salesforce all'avanguardia. Nuvolar, fondata nel 2008 e con sede in Spagna, offre sviluppo digitale completo di prodotti con profonde competenze nella forza di vendita, nelle applicazioni web e mobile personalizzate...
-
NetApp arbeitet mit Google Cloud zusammen, um die Dateninfrastruktur für die verteilte Cloud zu stärken
SAN JOSE, Kalifornien--(BUSINESS WIRE)--NetApp® (NASDAQ: NTAP), das Unternehmen für intelligente Dateninfrastruktur, gab heute bekannt, dass es seine Zusammenarbeit mit Google Cloud durch einen vierjährigen Enterprise-Vertrag erweitert hat, um die Bereitstellung der NetApp-Speicherlösungen innerhalb der Google Distributed Cloud Air-Gapped (GDC) zu beschleunigen – Googles souveräne Cloud-Plattform, die von World Wide Technology (WWT) bereitgestellt wird. Die NetApp-Datenplattform innerhalb diese...
-
Andersen Consulting s'associe au cabinet Nuvolar
SAN FRANCISCO--(BUSINESS WIRE)--Andersen Consulting étend sa plateforme de transformation numérique grâce à un accord de collaboration avec Nuvolar, un cabinet de conseil en technologie spécialisé dans le développement de logiciels basés sur le cloud et les implémentations avancées de Salesforce. Fondée en 2008 et basée en Espagne, Nuvolar propose des services complets de développement de produits numériques, s'appuyant sur une expertise approfondie en matière de Salesforce, d'applications web...
-
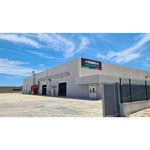
Riassunto: Wipro Hydraulics sigla un accordo definitivo con Indeco per ampliare l'offerta dei prodotti
BARI, Italia, e BANGALORE, India--(BUSINESS WIRE)--Wipro Hydraulics e Indeco Ind Spa sono orgogliose di annunciare la sigla di un accordo definitivo che prevede, da parte di Wipro, l'acquisizione di Indeco Ind Spa. Questa storica partnership coincide con un momento simbolico, dato che entrambe le aziende celebrano i 50 anni di eccellenza ingegneristica e di leadership di mercato. L'operazione riunisce due leader nei rispettivi campi di attività: Indeco, punto di riferimento globale negli access...
-
Wipro Hydraulics unterzeichnet endgültige Vereinbarung mit Indeco zur Erweiterung des Produktangebots
BARI, Italien & BENGALURU, Indien--(BUSINESS WIRE)--Wipro Hydraulics und Indeco Ind Spa geben stolz bekannt, dass sie eine endgültige Vereinbarung über die Übernahme von Indeco Ind Spa durch Wipro geschlossen haben. Diese wegweisende Partnerschaft kommt zu einem symbolträchtigen Zeitpunkt, da beide Unternehmen auf 50 Jahre technische Exzellenz und Marktführerschaft zurückblicken. Der Zusammenschluss vereint zwei Marktführer in ihren jeweiligen Bereichen : Indeco, ein weltweit führender Anbieter...
