Newsroom
Sorted by: Latest
-
Faraday Future EAI Data Factory Signs First Sales Order, Closing the Data Commercialization Loop and Advancing the “Three-in-One” EAI Ecosystem Strategy
LOS ANGELES--(BUSINESS WIRE)--Faraday Future Intelligent Electric Inc. (NASDAQ: FFAI) (“Faraday Future,” “FF,” or the “Company”), a California-based global Embodied AI (EAI) ecosystem company, today announced that its Data Factory Business Unit has signed its first sales order. As a key pillar of FF’s “Three-in-One” EAI ecosystem strategy spanning Device, Brain, and Data, the Data Factory’s launch closes the EAI ecosystem’s data commercialization loop and continues to strengthen the Device-Data...

-
Hagens Berman Files New Securities Class Action Against Super Micro Computer (SMCI) And Its Senior Executives: New Complaint Alleges Additional Corrective Disclosures; Lead Plaintiff Filing Deadline Remains May 26, 2026
SAN FRANCISCO--(BUSINESS WIRE)--Hagens Berman announces that the firm has filed a new class action lawsuit in the U.S. District Court for the Northern District of California asserting claims for violations of the federal securities laws by Super Micro and certain of its senior executives, alleging that Defendants concealed a massive illegal scheme to sell billions of dollars’ worth of advanced AI servers—powered by Nvidia chips subject to U.S. export restrictions—to the People's Republic of Chin...

-
Pan American Silver to Host Investor Day on June 1, 2026
VANCOUVER, British Columbia--(BUSINESS WIRE)--Pan American Silver Corp. (NYSE: PAAS) (TSX: PAAS) ("Pan American") will host an Investor Day on Monday, June 1, 2026 in Toronto, Ontario from 1:00 to 4:00 pm ET during which Pan American's executive management team will provide detailed presentations on Pan American's strategy, operations, growth projects and exploration activities. The event will include a question-and-answer session with management. Webcast details: Date: Monday, June 1, 2026 Tim...
-
Riassunto: Telehouse Canada riceve un importante aggiornamento infrastrutturale per ampliare le organizzazioni basate sull'AI
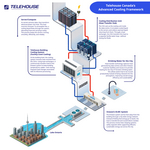
TORONTO--(BUSINESS WIRE)--Telehouse Canada, un importante fornitore leader di servizi per centri dati e un'azienda controllata di KDDI Corporation, ha reso noto il completamento di un sostanziale aggiornamento infrastrutturale progettato per supportare i carichi di lavoro basati sull'AI di nuova generazione. Introducendo la tecnologia diretta liquid‑to‑chip, Telehouse permette implementazioni di inferenza AI ad alta densità all'interno dei suoi contesti di data center urbani altamente interconn...

-
Samenvatting: Telehouse Canada voert een ingrijpende infrastructuurvernieuwing door om AI-gedreven organisaties te ondersteunen
TORONTO--(BUSINESS WIRE)--Telehouse Canada, een toonaangevende aanbieder van datacenterdiensten en dochteronderneming van KDDI Corporation, heeft aangekondigd dat het een ingrijpende infrastructuurupgrade heeft voltooid die is ontworpen om de volgende generatie AI-gestuurde workloads te ondersteunen. Door de introductie van directe liquid-to-chip-technologie maakt Telehouse implementaties van AI-inferentie met hoge dichtheid mogelijk binnen zijn datacenteromgevingen in het centrum van Toronto,...
-
New Director Representing the City of Los Angeles Joins Metropolitan Board of Directors
LOS ANGELES--(BUSINESS WIRE)--Sustainable food and water policy leader Paula Daniels was seated Tuesday as the City of Los Angeles’ newest representative on the board of directors of the Metropolitan Water District of Southern California. Daniels has spent more than two decades working to advance public policy on food systems and sustainability in the government, academic and non-profit sectors. She is currently the inaugural executive director of the Los Angeles County Office of Food Systems,...

-
Telehouse Canada moderniza su infraestructura para acompañar la expansión de las organizaciones impulsadas por IA
TORONTO--(BUSINESS WIRE)--Telehouse Canada, proveedor líder de servicios de centros de datos y filial de KDDI Corporation, anunció la finalización de una importante modernización de infraestructura destinada a respaldar la próxima generación de cargas de trabajo impulsadas por inteligencia artificial. Mediante la incorporación de tecnología de refrigeración líquida directa al chip, la empresa habilita implementaciones de inferencia de IA de alta densidad dentro de sus centros de datos altamente...

-
Investcorp Credit Management BDC, Inc. Announces Financial Results for the Quarter Ended March 31, 2026
NEW YORK--(BUSINESS WIRE)--Investcorp Credit Management BDC, Inc. (NASDAQ: ICMB) (“ICMB” or the “Company”) announced its financial results today for its fiscal quarter ended March 31, 2026. HIGHLIGHTS ICMB fully realized its investments in three portfolio companies during the quarter, totaling $12.7 million in proceeds. The internal rate of return on these investments was 10.67%. During the quarter, ICMB made an investment in one existing portfolio company. The investment was $0.1 million, at c...
-
Telehouse Canada realiza grande atualização de infraestrutura para escalar organizações orientadas por IA
TORONTO--(BUSINESS WIRE)--A Telehouse Canada, provedora líder de serviços de data center e subsidiária da KDDI Corporation, anunciou a conclusão de uma grande atualização de infraestrutura projetada para suportar a próxima geração de cargas de trabalho orientadas por IA. Ao introduzir a tecnologia de resfriamento líquido direto para o chip, a Telehouse possibilita implantações de inferência de IA de alta densidade em seus ambientes de data center no centro de Toronto, com ampla interconexão. Is...

-
Mobbin Launches MCP Server, Giving AI Tools 621,500 Real App Screens to Reference
SINGAPORE--(BUSINESS WIRE)--Mobbin today launched Mobbin MCP, a Model Context Protocol server that connects AI agents to 621,500+ real app screens directly from Claude, Cursor, Lovable, and more. It's built for developers building UI with AI tools, designers who want their AI tools to reference real apps, and product teams that need AI output grounded in real patterns. AI tools generate interfaces fast. But without references, the output is generic. Same hero section. Same card layout. Same onb...