

Newsroom
Sorted by: Latest
-
Samenvatting: Signaloid geeft een voorproefje van zijn nieuwe ASIC en een demonstratie van zijn UxHw®-technologie op Bosch Connected World
CAMBRIDGE, Engeland--(BUSINESS WIRE)--Het Britse IT-bedrijf Signaloid presenteert deze week een voorproefje van zijn C0-ASIC voor fysieke AI tijdens Bosch Connected World, dat op 10 en 11 juni in Berlijn plaatsvindt. De ASIC is ontworpen voor robotica, industriële automatisering en probabilistische AI-toepassingen. Naar verwachting zal hij tot wel 1000 keer betere prestaties per watt leveren dan de huidige geavanceerde oplossingen. Deze bekendmaking is officieel geldend in de originele brontaal...
-
Riassunto: Signaloid presenterà in anteprima il nuovo ASIC e la demo della sua tecnologia UxHw® a Bosch Connected World
CAMBRIDGE, Inghilterra--(BUSINESS WIRE)--La società britannica di tecnologia informatica Signaloid presenterà in anteprima la sua soluzione C0-ASIC per l'IA fisica questa settimana in occasione di Bosch Connected World, che si terrà dal 10 all'11 giugno a Berlino. Progettato per i settori di robotica, automazione industriale e carichi di lavoro IA probabilistica, si prevede che il circuito ASIC offrirà prestazioni per Watt fino a 1000 volte superiori rispetto alle attuali strategie all'avanguar...
-
Resumen: Signaloid presentará un avance de su nuevo ASIC y una demostración de su tecnología UxHw® en Bosch Connected World
CAMBRIDGE, Inglaterra--(BUSINESS WIRE)--La empresa británica de tecnología informática Signaloid presentará esta semana su C0-ASIC para IA física en la exposición Bosch Connected World, que se celebrará los días 10 y 11 de junio en Berlín. Diseñado para aplicaciones de robótica, automatización industrial y cargas de trabajo de IA probabilística, se prevé que el ASIC ofrezca un rendimiento por vatio hasta 1000 veces mayor al de los planteamientos más vanguardistas existentes hasta ahora. El comu...
-
Trustd Brings Know Your Carrier to Market as Freight Fraud Costs European Supply Chains Over €1bn
OBERHAUSEN, Germany--(BUSINESS WIRE)--Trustd brings Know Your Carrier to market as cargo crime across EMEA rises 438% in three years...
-
End the Global Debt Trap: Freedom from Debt Now, says AHF
LOS ANGELES--(BUSINESS WIRE)--As part of the global Freedom from Debt campaign launch, nearly 50 AIDS Healthcare Foundation (AHF) country teams and partners will commence multiple in-person and virtual advocacy actions that call for urgent reforms to a global debt system that prevents developing countries from investing in healthcare, education, and other basic human needs. Debt injustice demands a global system that prioritizes people over profit and ensures countries can meet the basic needs...
-
ABL Diagnostics (ABLD) Announces the Submission of a Takeover Bid for Texcell France
WOIPPY, France--(BUSINESS WIRE)--Regulatory News: ABL Diagnostics (Paris:ABLD) (Euronext Paris – Compartment B – ISIN: FR001400AHX6), a company specialized in molecular diagnostic solutions, healthcare software, and clinical sample management, announces that on Tuesday, June 9, 2026, it submitted a bid to acquire the business and assets of TEXCELL, a company specialized in viral safety testing, immunology, and R&D services for biopharmaceutical products, currently subject to judicial reorga...
-
Xilam s’illustre au Festival international du film d’animation d’Annecy avec une présence record en cinéma et télévision
PARIS--(BUSINESS WIRE)--Regulatory News: Xilam Animation (Paris:ALXIL), société indépendante de production et de distribution de programmes d’animation, marquera le Festival international du film d’animation d’Annecy par une actualité riche autour de ses longs métrages et séries. Les temps forts incluent notamment une séance « Work in Progress » consacrée au Loup, son prochain long métrage, en forme de thriller psychologique, adapté de la bande dessinée de Jean-Marc Rochette, ainsi que les séle...
-
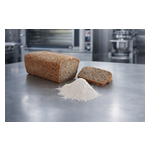
New Gluten-Free Bread Binder Simplifies the Recipe — and Boosts Bread Quality
BÆKKE, Denmark--(BUSINESS WIRE)--FERM FOOD ApS is launching a gluten-free, fermented binder for industrial bakeries. The new binder solves well-known challenges in gluten-free bread production from loose structure and crumbliness to the use of many separate additives. The bread binder makes it possible to reduce the number of additives in the recipe and improve structure, sliceability, and taste. "Our new gluten-free bread binder has been developed to make production simpler and more flavourful...
-
Sofinnova Partners avvia una collaborazione con AWS per accelerare l’adozione dell’AI nell’innovazione delle scienze della vita
MILANO--(BUSINESS WIRE)--Sofinnova Partners (“Sofinnova”), società europea leader nel venture capital nel settore delle scienze della vita, con sedi a Parigi, Londra e Milano, annuncia oggi una collaborazione con Amazon Web Services (AWS) per integrare più profondamente l’AI nella propria piattaforma di investimento e nelle società in portafoglio. La collaborazione sostiene Sofinnova.AI, l’iniziativa della società volta a integrare l’AI nelle sue attività principali, dall’individuazione e valut...

-
Xilam Lands at Annecy International Animation Festival with Historic Raft of Film and Television Activity
PARIS--(BUSINESS WIRE)--Regulatory News: Academy Award®-nominated French animation company Xilam (Paris:ALXIL) is heading to Annecy International Animation Festival with a wave of activity across its features and series slate, including a Work-In-Progress session for upcoming psychological thriller feature The Wolf based on the graphic novel by Jean Marc Rochette; alongside official selections for Lucy Lost, a film adaptation of Listen to the Moon by British author Michael Morpurgo, and new Dis...