

Newsroom
Sorted by: Latest
-
リーバイス®ブランド、スーパーボウルでフィルムでバックストーリーとバックサイドをハイライトとする「Behind Every Original」キャンペーンを発表
サンフランシスコ--(BUSINESS WIRE)--(ビジネスワイヤ) -- リーバイス®ブランドは、「Behind Every Original」キャンペーンを発表しました。これは、文化を前進させる人々を、ちょっとした工夫を凝らして称える、大胆で新しいグローバルキャンペーンです。スーパーボウルで初公開されるキム・ゲーリック監督のアンセムフィルム「Backstory」では、リーバイス®ブランドは、アイコン的存在のセレブリティと普段使いのOriginalsをバックサイドからのみ映し出し、画期的なリーバイス®のバックストーリーとすることで、人々の予想を覆します。 今回バックサイドが注目された理由は、リーバイス®ジーンズの最も象徴的な視点だからです。そのアーチ状のステッチ、シルエット、そしてRed Tab™は、瞬時にそのオリジナリティを表現します。リーバイス®ジーンズは150年以上にわたり、既成概念にとらわれず、音楽、スポーツ、ファッション、アートの未来を形作る文化のカタリストたちのユニフォームであり続けてきました。リーバイ・ストラウスは、世界に変革を起こし、文化を形作ったムーブメントや...

-
Levi’s® lancia la campagna “Behind Every Original” con un film per il Super Bowl che mette in luce varie storie personali e... i didietro
SAN FRANCISCO--(BUSINESS WIRE)--Levi’s® ha lanciato oggi “Behind Every Original” (“Ciò che c’è di dietro ogni originale”), una nuova e audace campagna globale che celebra le persone che spingono la cultura in avanti – con un tocco impertinente. Esordendo durante il Super Bowl con il film manifesto “Backstory”, diretto da Kim Gehrig, il brand Levi’s® ribalta le aspettative mostrando icone celebri e “Originali” comuni esclusivamente dal didietro, lasciando che condividano la loro rivoluzionaria s...
-
Au-delà des benchmarks : Xavier Grand, directeur technique d’Algolia, participe à la table ronde de l’AI Day France 2026 sur le rôle d’Algolia dans la révolution GenAI UX
PARIS--(BUSINESS WIRE)--Algolia, la plateforme de recherche et de récupération IA qui traite plus de 1,75 billion de requêtes chaque année et à laquelle font confiance plus de 18 000 entreprises et des millions de développeurs à travers le monde, a annoncé aujourd’hui que son directeur technique, Xavier Grand, prendra la parole lors de l’AI Day 2026 qui se tiendra à Paris le 10 février. Organisée à la Station F et présentée par France Digitale, la 10e édition annuelle de l’AI Day réunira 2 000...
-
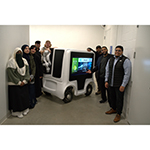
Kiwi Charge Launches Autonomous EV Charging Project with $1.7 Million in Funding
TORONTO--(BUSINESS WIRE)--Robotics and AI startup Kiwi Charge today announced the launch of its autonomous electric vehicle (EV) charging project with the backing of the Government of Ontario through the Ontario Vehicle Innovation Network (OVIN), and support from General Motors Canada and Pfaff Automotive. The project represents a total investment of $1.7 million to fund the development of mobile EV charging solutions that combine artificial intelligence (AI), robotics, and electrification to c...
-
TIGER 21 Draws Global Leaders, CEOs and Former Heads of State to 2026 Global Exchange
NEW YORK--(BUSINESS WIRE)--TIGER 21, the premier peer membership community for ultra-high-net-worth wealth creators and leaders, has concluded its 2026 Global Exchange, held January 26–28 in Las Vegas, Nevada. The annual flagship event brought together over 1,000 attendees, including 700 Members, from across North America, Europe, the Middle East and Asia. The three-day gathering explored the forces reshaping wealth, leadership and wellbeing — from artificial intelligence and geopolitics to lon...
-
Arlington Dermatology Clinic Joins Epiphany Dermatology
AUSTIN, Texas--(BUSINESS WIRE)--Epiphany Dermatology, a leading dermatology company committed to improving access to exceptional dermatologic care, announced today it has expanded its presence in the Dallas-Fort Worth, TX, market through its partnership with Arlington Dermatology Clinic, PA. Upon joining Arlington Dermatology in 1994 and then becoming the practice owner in 2003, Mary Adams, MD, has a long-established reputation of providing high-quality dermatology services to patients in the g...
-
CapRelo Develops CoreTech AI Platform to Reimagine Global Relocation Services, Making Moves Simpler and Seamless for Both Transferee and HR Teams
STERLING, Va.--(BUSINESS WIRE)--CapRelo, a global relocation management company, has reengineered its global mobility products by building CoreTech platform which utilizes AI....

-
La marque Levi’s® lance la campagne « Behind Every Original » avec un film diffusé pendant le Super Bowl qui met en avant les coulisses et les arrières-plans
SAN FRANCISCO--(BUSINESS WIRE)--La marque Levi’s® a lancé aujourd'hui « Behind Every Original », une nouvelle campagne mondiale audacieuse qui rend hommage aux personnes qui font avancer la culture, avec une touche d'impertinence. Lancée pendant le Super Bowl avec le film « Backstory », réalisé par Kim Gehrig, la marque Levi’s® renverse les attentes en présentant à la fois des célébrités et des personnes ordinaires exclusivement de dos, leur permettant ainsi de partager leur histoire Levi’s® qu...

-
Die Marke Levi’s® lanciert „Behind Every Original“-Kampagne mit Super Bowl-Film, der Backstories und Backsides zeigt
SAN FRANCISCO--(BUSINESS WIRE)--Die Marke Levi’s® hat heute ihre neue globale Kampagne „Behind Every Original“ vorgestellt. Die aufmerksamkeitsstarke Kampagne würdigt die Menschen, die Kultur vorantreiben – mit einem frechen Twist. Die Kampagne debütierte während des Super Bowl mit dem Anthem-Film „Backstory“ unter der Regie von Kim Gehrig. Darin stellt Levi’s® alle Erwartungen auf den Kopf, indem die Marke sowohl prominente Ikonen als auch alltägliche „Originals“ ausschließlich von hinten zeig...

-
Levi’s®品牌全新推出“Behind Every Original”全球营销活动,超级碗影片聚焦人物故事与牛仔背影
旧金山--(BUSINESS WIRE)--(美国商业资讯)-- Levi’s®品牌今日正式推出大胆的全新全球营销活动“Behind Every Original”,以独具巧思的方式致敬一众推动文化发展的先锋人物。该活动于超级碗赛事期间重磅首发,由Kim Gehrig执导的主题影片《背后的故事》(Backstory)惊艳亮相,Levi’s®品牌打破大众固有期待,镜头全程独拍各界明星大咖与平凡原创者的背影,让他们娓娓道来自己与Levi’s®结缘、改变人生的独家故事。 为何独选背影视角?只因这是Levi’s®牛仔裤最具标志性的视觉符号。弧形车线、经典廓形与红标(Red Tab™)设计,一眼便能彰显原创本色。150多年来,Levi’s®牛仔裤早已成为文化先锋们的经典穿搭,他们敢于走出常规、独辟蹊径,在音乐、体育、时尚与艺术领域定义潮流未来。无论是推动时代变革的社会运动,还是塑造文化走向的关键瞬间,那些追寻进步的先行者们,都身着我们的牛仔裤留下了属于自己的印记。 Levi Strauss & Co.全球首席营销官Kenny Mitchell表示:“‘Behind Every Origi...
