

Newsroom
Sorted by: Latest
-
KALEON: EQUITA and TP ICAP Midcap Initiate Coverage with BUY Recommendations and Price Targets of €5.00 and €5.50 per Share, Respectively
MILAN, Italy--(BUSINESS WIRE)--Regulatory News: Kaleon (Paris:ALKLN) (MIL:KLN), a company controlled by the Borromeo family and specialised in the management and tourism enhancement of artistic, natural, and cultural heritage, today announces that leading Italian and French brokers, EQUITA and TP ICAP Midcap, have initiated research coverage of its stock. EQUITA has published a BUY recommendation with a target price of €5.00 per share, while TP ICAP Midcap, has also initiated coverage with a BU...
-
KALEON : EQUITA et TP ICAP Midcap initient la couverture du titre avec une recommandation à l’ACHAT et des objectifs de cours respectifs de 5,00 € et 5,50 € par action
MILAN, Italie--(BUSINESS WIRE)--Regulatory News: Kaleon (Paris:ALKLN) (MIL:KLN), une société contrôlée par la famille Borromeo, spécialisée dans la gestion et la valorisation touristique du patrimoine artistique, naturel et culturel, annonce aujourd’hui la couverture de son titre par des brokers de premier plan, EQUITA et TP ICAP Midcap. EQUITA a émis une recommandation ACHAT avec un cours cible de 5,00 € par action, tandis que TP ICAP Midcap a également initié la couverture avec une recommanda...
-
L.L.Bean Selects Amperity to Revamp End-to-End Customer Journeys and Boost Loyalty
SEATTLE--(BUSINESS WIRE)--L.L.Bean, Inc., the iconic outdoor lifestyle retailer, has selected Amperity to power a new era of personalization across customer experiences. With Amperity, L.L.Bean will use deeper insights to grow loyalty and brand affinity. Teams will be empowered to better understand customers, respond faster, and deliver the right experiences. The partnership will replace outdated systems, streamline workflows, and ensure every customer interaction is relevant and timely. “At L....
-
Kirin与Immunosens联合开发自检服务,利用尿液IgA直观呈现人体免疫状态
日本东京和大阪--(BUSINESS WIRE)--(美国商业资讯)-- Kirin Holdings Company, Limited (Kirin Holdings)和Immunosens Co., Ltd. (Immunosens)已启动一项独创“自检服务*1”的联合开发,旨在直观呈现人体的免疫状态。 Kirin Holdings通过KIRIN健康创新基金对Immunosens进行了投资*2。该基金是公司于2023年2月与日本领先的独立风险投资公司Global Brain Corporation共同设立的企业风险投资基金。双方一直在探索将Immunosens专有的POCT*3设备作为健康管理工具的应用潜力,以帮助消费者在疾病前期维持健康。 Kirin Holdings现已与Immunosens签订委托研究协议。通过结合Immunosens的专有技术,以及Kirin在全球首次发现*4的与浆细胞样树突状细胞(pDC)活性相关的尿液标志物,两家公司旨在开发一款简单而高精度的免疫功能可视化服务。 2025年5月公布的检测服务为邮寄式检测,可让个人定期监测自身免疫状态*5。与此不同,本次与...

-
Kirin與Immunosens共同開發自檢服務,利用尿液IgA直覺式呈現人體免疫狀態
日本東京和大阪--(BUSINESS WIRE)--(美國商業資訊)-- Kirin Holdings Company, Limited (Kirin Holdings)和Immunosens Co., Ltd. (Immunosens)已啟動一項獨創「自檢服務*1」的共同開發,旨在直覺式呈現人體的免疫狀態。 Kirin Holdings透過KIRIN健康創新基金對Immunosens進行了投資*2。該基金是公司於2023年2月與日本首屈一指的獨立創投公司Global Brain Corporation共同設立的企業創投基金。雙方一直在探索將Immunosens專有的POCT*3裝置做為健康管理工具的應用潛力,以協助消費者在疾病前期維持健康。 Kirin Holdings現已與Immunosens簽署委託研究協議。透過結合Immunosens的專有技術,以及Kirin在全球首次發現*4的與漿細胞樣樹突細胞(pDC)活性相關的尿液標記,兩家公司旨在開發一款簡單而又高精確度的免疫功能視覺化服務。 2025年5月公布的檢測服務為郵寄式檢測,可讓個人定期監測自身免疫狀態*5。與此不同,本次與I...
-
Trulioo Named a BC Top Employer for Second Consecutive Year; Appoints Jana Hill as Chief People Officer
VANCOUVER, British Columbia--(BUSINESS WIRE)--Trulioo earns BC Top Employer recognition for a second year and appoints Jana Hill as Chief People Officer, reinforcing its talent-driven culture....
-
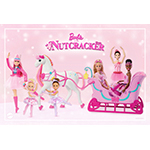
Barbie Commemorates 25 Years of “Barbie in the Nutcracker” with an All-New Animated Special Premiering Globally in 2026
EL SEGUNDO, Calif.--(BUSINESS WIRE)--Mattel, Inc. (NASDAQ: MAT), a leading global toy and family entertainment company and owner of one of the most iconic brand portfolios in the world, announced today that Barbie® is kicking off a year-long celebration to mark the 25th anniversary of the iconic Barbie™ in the Nutcracker - the special that launched the brand’s animated legacy and became a holiday classic for generations. Barbie is setting the stage for a year filled with new dolls, consumer pro...
-
Equal Parts Secures $23M in Funding to Transform Independent Insurance With Blend of AI Tools and Human Relationships
AUSTIN, Texas--(BUSINESS WIRE)--Equal Parts, an insurance platform focused on transforming independent agencies, today announced it has raised $23M in Series A funding led by Inspired Capital. The investment will enable the company to accelerate its mission to acquire independent agencies and equip them with AI tools that extend their reach and increase their impact. Since its founding in March 2025, Equal Parts has increased revenue growth for its acquired agencies by nearly 40% and delivered...
-
Appficiency Inc. Announces Strategic Investment from Canadian Business Growth Fund to Accelerate Expansion
TORONTO--(BUSINESS WIRE)--Appficiency Inc. (“Appficiency”), a global IT consulting firm and software business delivering AI-powered enterprise digital transformation services, today announced it has received a minority equity investment from Canadian Business Growth Fund (“CBGF”). The investment represents a major milestone in Appficiency’s growth journey and will fuel AI innovation and expanded capabilities to serve enterprise clients across multiple platforms. Founded in 2014, Appficiency sup...
-
Medincell’s ISS ESG Corporate Rating Upgraded
MONTPELLIER, France--(BUSINESS WIRE)--Regulatory News: Medincell (Euronext Paris: MEDCL), a commercial- and clinical-stage biopharmaceutical licensing company developing long-acting injectable treatments, today announces that ISS has upgraded the company’s ESG rating from C+ to B. Medincell is ranked within the first decile of the Pharmaceuticals & Biotechnology sector, benefits from ISS ESG Prime Status, and achieves a very high level of ESG disclosure transparency. This updated rating is...