
")
SAN FRANCISCO--(BUSINESS WIRE)--SoFi Technologies, Inc. (NASDAQ: SOFI), a member-centric, one-stop shop for digital financial services that helps members borrow, save, spend, invest and protect their money, reported financial results today for its fourth quarter and fiscal year ended December 31, 2021.
“We hit new highs across our key financial and operating metrics in the fourth quarter, finishing 2021 with record annual results,” said Anthony Noto, CEO of SoFi Technologies, Inc. “Adjusted net revenue of $280 million was another quarterly record for us, up 54% year-over-year and up sequentially, even with the unexpected extension of the federal student loan payment moratorium in late December. We exceeded $1 billion in annual adjusted net revenue for the first time. We also delivered fourth quarter adjusted EBITDA of $5 million — our sixth consecutive positive quarter — resulting in positive full-year adjusted EBITDA of $30 million. The best part is that we were able to reach both our adjusted revenue and adjusted EBITDA milestones ahead of plan in an increasingly challenging operating environment, while also significantly exceeding our member growth guidance.”
Consolidated Results Summary
|
|
Three Months Ended December 31, |
|
% Change |
|
Year Ended December 31, |
|
% Change |
||||||||||||||
($ in thousands) |
|
|
2021 |
|
|
|
2020 |
|
|
|
|
2021 |
|
|
|
2020 |
|
|
||||
Consolidated – GAAP |
|
|
|
|
|
|
|
|
|
|
|
|
||||||||||
Total net revenue |
|
$ |
285,608 |
|
|
$ |
171,491 |
|
|
67 |
% |
|
$ |
984,872 |
|
|
$ |
565,532 |
|
|
74 |
% |
Net loss |
|
|
(111,012 |
) |
|
|
(82,616 |
) |
|
34 |
% |
|
|
(483,937 |
) |
|
|
(224,053 |
) |
|
116 |
% |
Loss per share – basic and diluted |
|
$ |
(0.15 |
) |
|
$ |
(1.85 |
) |
|
|
|
$ |
(1.00 |
) |
|
$ |
(4.30 |
) |
|
|
||
|
|
|
|
|
|
|
|
|
|
|
|
|
||||||||||
Consolidated – Non-GAAP |
|
|
|
|
|
|
|
|
|
|
|
|
||||||||||
Adjusted net revenue(1) |
|
$ |
279,876 |
|
|
$ |
182,019 |
|
|
54 |
% |
|
$ |
1,010,325 |
|
|
$ |
621,207 |
|
|
63 |
% |
Adjusted EBITDA(1) |
|
|
4,593 |
|
|
|
11,817 |
|
|
(61 |
) % |
|
|
30,221 |
|
|
|
(44,576 |
) |
|
n/a |
|
___________________
(1) |
Adjusted net revenue and adjusted EBITDA are non-GAAP financial measures. For more information and reconciliations to the most comparable GAAP measures, see “Non-GAAP Financial Measures” and Table 2 to the “Financial Tables” herein. |
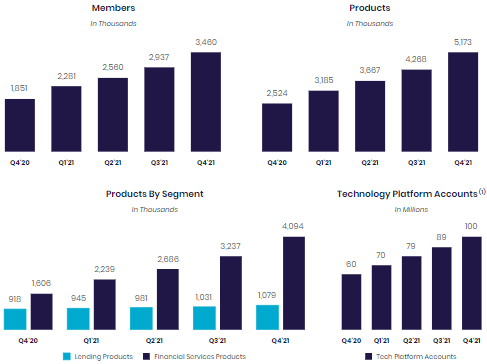
Noto continued: “As important, we also reached all-time highs in members added, products added and engagement as well. We finished 2021 with approximately 3.5 million total SoFi members, up 87%, or 1.6 million, from where we started the year, and approximately 500,000 ahead of our stated goal. We added a record 523,000 new members in the fourth quarter — a new high in absolute number terms, up 39% versus the number of net adds in Q3 2021. We also extended our string of triple-digit year-over-year product growth for the sixth consecutive quarter, adding 906,000 new products, up 51% versus the number of net adds in the third quarter, to end 2021 with a record 5.2 million products in total, more than 2.6 million, or 105%, higher from where we started the year. We were able to achieve these milestones in 2021 — and get to such a position of strength today — for three main reasons: First, we continued to drive strong growth through great execution across our three diverse businesses, as we adapted to capitalize on changing macro conditions. Second, the success of our unique Financial Services Productivity Loop (FSPL) strategy accelerated as we scaled our business in 2021 — allowing us to exceed our original 2021 member growth target by 40% and still hit our adjusted EBITDA target. And third, we took a giant step forward in 2021 in achieving our goal of becoming a household brand name by investing in and growing our brand awareness via our SoFi Stadium affiliation, the success of our integrated multi-media campaigns and the virality of the influencers with whom we partnered.”
Noto concluded: “Today, SoFi is in its strongest position ever to differentiate our offerings and ensure that we're delivering for our members and enhancing their experience with each new product they adopt. Our new bank charter will be a game changer for us in differentiating our SoFi Checking and Savings offering in the marketplace, and improving our pricing and selection across Lending. Acquiring Technisys, a leading cloud-native, digital multi-product core banking platform, will be a critical next step in our continued efforts to vertically integrate SoFi’s businesses to further accelerate the pace of innovation of our best-of-breed financial products. We expect Technisys to be a growth multiplier for both SoFi and Galileo, in addition to realizing its own enormous growth opportunities, which are further strengthened in partnership with Galileo. We think we are well on our way to building the AWS of fintech. We have the right strategy, offering, leadership, liquidity and people to achieve our long-term strategic goal to be the digital one-stop shop for our members for all of the major financial decisions in their lives, and all of the moments in between. Having just celebrated my fourth anniversary as CEO of SoFi in February, I could not be more excited about what’s ahead, and I feel like we are just getting started.”
Consolidated Results
Total GAAP net revenue of $285.6 million in the fourth quarter of 2021 and $984.9 million for full-year 2021 increased 67% and 74%, respectively, from the corresponding prior-year periods of $171.5 million and $565.5 million, respectively. On an adjusted basis, net revenue of $279.9 million for the fourth quarter and $1.01 billion for the full year were up 54% and 63%, respectively, from the corresponding prior-year period totals of $182.0 million and $621.2 million, respectively. Strength in all three of SoFi's business segments drove the year-over-year growth in these measures.
SoFi recorded a GAAP net loss of $111.0 million for the fourth quarter of 2021 and $483.9 million for full-year 2021, versus the prior-year periods' net losses of $82.6 million and $224.1 million, respectively. Fourth quarter adjusted EBITDA of $4.6 million was positive for the sixth consecutive quarter, culminating in full-year positive adjusted EBITDA of $30.2 million.
Member and Product Growth
SoFi added a record number of both members and products in absolute terms for the quarter and year. The SoFi Stadium affiliation, together with successful integrated marketing and influencer campaigns, took brand recognition to new highs, which SoFi leveraged through better execution of its unique Financial Services Productivity Loop (FSPL) strategy.
The five nationally televised NFL regular season games at SoFi Stadium were seen by an average of more than 22 million households per game, for 110 million-plus household impressions in total. This visibility helped to increase SoFi’s unaided brand awareness by nearly 70% in 2021, which reached a new record in the fourth quarter. SoFi unaided brand awareness rose again in February 2022, when an estimated 106 million people watched the Los Angeles Rams win the Super Bowl at home at SoFi Stadium.
These brand-building strategies, coupled with referral and cross-buy campaigns such as Refer the App, the SoFi Money Referral program, the SoFi Money-Personal Loan bundle, and SoFi’s unique rewards program, drove record new member and product additions. SoFi added approximately 523,000 new members in the fourth quarter – a record in absolute number terms and up 39% from the approximately 377,000 new members added in the third quarter, to finish 2021 at 3.5 million, up 1.6 million, or 87%, from 2020.
Total products added in the fourth quarter of approximately 906,000 were 51% higher than the approximately 600,000 added in the third quarter, and up 105% year-over-year, for SoFi’s sixth consecutive quarter of triple-digit growth. Total products of nearly 5.2 million at year-end were more than double the 2.5 million at year-end 2020. With product growth exceeding member growth in absolute terms, members are demonstrating high product satisfaction and greater willingness to adopt additional products, further reinforcing the value of SoFi’s unique FSPL strategy.
(1) |
Beginning in the fourth quarter of 2021, the Company included SoFi accounts on the Galileo platform-as-a-service in its total Technology Platform accounts metric to better align with presentation of Technology Platform segment revenue. The Company recast the total accounts as of December 31, 2020 to conform to the current year presentation, which resulted in an increase of 375,367 in total accounts as of such date. Quarterly amounts for the relevant quarters in 2021 and 2020 were determined to be immaterial, and as such were not recast. |
In the Financial Services segment, total products increased by 155% year-over-year, to 4.1 million from 1.6 million, driven primarily by growth in SoFi Invest and SoFi Money offerings.
Lending products rose 18% in the fourth quarter, and were up across all loan types. Record demand for personal loans was the largest driver, followed by an increase in demand for student loans in the lead-up to the anticipated January 2022 expiration of the moratorium on federal student loan payments.
With the rapid growth in Financial Services products, SoFi finished 2021 with nearly four times as many of these high-frequency, low acquisition cost, “top-of-funnel” products as low-frequency, high lifetime value (LTV), “bottom-of-funnel” Lending products. With these “top-of-funnel” offerings driving product growth, total company fourth quarter cross-buy volume — the term for when existing SoFi members acquire an additional SoFi product — more than tripled year-over-year, to SoFi’s highest absolute number of cross-bought products ever.
Technology Platform enabled accounts increased by 67% year-over-year to 99.7 million, due to both diverse new client additions and growth among existing Galileo clients.
Lending Segment Results
Lending segment GAAP and adjusted net revenues were $213.8 million and $208.0 million, respectively, for the fourth quarter of 2021, and $738.3 million and $763.8 million, respectively, for the full year. This represented quarterly year-over-year increases of 43% and 30%, respectively, and full year increases of 54% and 42%, respectively, driven by growth in net interest income, and origination and gain on sale revenue.
Lending segment contribution profit of $105.1 million, at a 51% margin of adjusted Lending net revenue for the fourth quarter of 2021, increased 23% year-over-year, but declined sequentially from the third quarter's $117.7 million of contribution profit at a 55% margin. This sequential decline was primarily due to lower home loan conversion at SoFi’s third-party fulfillment partner in home loans, which reduced SoFi's ability to meet strong home loans demand. These issues have since been resolved by the onboarding of another third-party fulfillment partner. Additionally, higher student loan refinancing marketing spend to drive volume in the lead-up to the January 2022 federal student loan payment moratorium expiration was not recouped when the moratorium was extended in late-December, curtailing demand during the final week of the quarter. Full-year Lending segment contribution profit of nearly $400 million was up 65%, at a 52% margin.
Lending – Segment Results of Operations |
|
|
|
|
|
|
|
|
|
|
|
|
||||||||||
|
|
Three Months Ended December 31, |
|
|
|
Year Ended December 31, |
|
|
||||||||||||||
($ in thousands) |
|
|
2021 |
|
|
|
2020 |
|
|
% Change |
|
|
2021 |
|
|
|
2020 |
|
|
% Change |
||
Total net revenue – Lending |
|
$ |
213,764 |
|
|
$ |
148,992 |
|
|
43 |
% |
|
$ |
738,323 |
|
|
$ |
480,866 |
|
|
54 |
% |
Servicing rights – change in valuation inputs or assumptions |
|
|
(9,273 |
) |
|
|
1,127 |
|
|
(923 |
)% |
2,651 |
|
|
|
17,459 |
|
|
(85 |
) % |
||
Residual interests classified as debt – change in valuation inputs or assumptions |
|
|
3,541 |
|
|
|
9,401 |
|
|
(62 |
) % |
|
|
22,802 |
|
|
|
38,216 |
|
|
(40 |
) % |
Directly attributable expenses |
|
|
(102,967 |
) |
|
|
(74,316 |
) |
|
39 |
% |
|
|
(364,169 |
) |
|
|
(294,812 |
) |
|
24 |
% |
Contribution Profit |
|
$ |
105,065 |
|
|
$ |
85,204 |
|
|
23 |
% |
|
$ |
399,607 |
|
|
$ |
241,729 |
|
|
65 |
% |
|
|
|
|
|
|
|
|
|
|
|
|
|
||||||||||
Adjusted net revenue – Lending(1) |
|
$ |
208,032 |
|
|
$ |
159,520 |
|
|
30 |
% |
|
$ |
763,776 |
|
|
$ |
536,541 |
|
|
42 |
% |
_________________
| (1) | Adjusted net revenue – Lending represents a non-GAAP financial measure. For more information and a reconciliation to the most comparable GAAP measure, see “Non-GAAP Financial Measures” and Table 2 to the “Financial Tables” herein. |
Fourth quarter Lending segment total origination volume increased 67% year-over-year, with record volume in personal loan originations and higher student loan originations more than offsetting the decline in home loan volume.
Record personal loan originations of more than $1.6 billion in the fourth quarter of 2021 were up $1.0 billion, or 168%, year-over-year, and more than double fourth quarter 2019’s pre-pandemic total. SoFi’s personal loans business outperformed due to improved execution, technology and credit model enhancements, a reopening of personal loan credit eligibility and continued strong demand for its high-quality loans. Full-year personal loan originations of more than $5.3 billion were more than double the 2020 total and 44% above 2019’s pre-Covid level. In addition, providing loan referral fulfillment services to Pagaya, an artificial intelligence (AI) network that facilitates credit decisioning, enabled SoFi to access a broader audience to drive further growth in personal loans without taking additional underwriting risk.
In the fourth quarter, student loans benefited from accelerating demand ahead of the January federal student loan payment moratorium deadline and anticipated rate increases in 2022. Student loan originations of nearly $1.5 billion increased 51% sequentially – even with the unexpected late-December extension of the federal student loan payment moratorium to May 2022. This suggests there may be a rapid return to pre-pandemic student loan demand levels once the payment moratorium expires.
Lending – Originations and Average Balances |
|
|
|
|
|
|
|
|
|
|
||||||||
|
|
Three Months Ended December 31, |
|
% Change |
|
Year Ended December 31, |
|
% Change |
||||||||||
|
|
2021 |
|
2020 |
|
|
2021 |
|
2020 |
|
||||||||
Origination volume ($ in thousands, during period) |
|
|
|
|
|
|
|
|
|
|
|
|
||||||
Home loans |
|
$ |
657,304 |
|
$ |
672,724 |
|
(2 |
) % |
|
$ |
2,978,222 |
|
$ |
2,183,521 |
|
36 |
% |
Personal loans |
|
|
1,646,289 |
|
|
613,774 |
|
168 |
% |
|
|
5,386,934 |
|
|
2,580,757 |
|
109 |
% |
Student loans |
|
|
1,461,405 |
|
|
970,543 |
|
51 |
% |
|
|
4,293,526 |
|
|
4,928,880 |
|
(13 |
) % |
Total |
|
$ |
3,764,998 |
|
$ |
2,257,041 |
|
67 |
% |
|
$ |
12,658,682 |
|
$ |
9,693,158 |
|
31 |
% |
|
|
|
|
|
|
|
|
|
|
|
|
|
||||||
Average loan balance ($, as of period end)(1) |
|
|
|
|
|
|
|
|
|
|
|
|
||||||
Home loans |
|
$ |
286,991 |
|
$ |
291,382 |
|
(2 |
) % |
|
|
|
|
|
|
|||
Personal loans |
|
|
22,820 |
|
|
21,789 |
|
5 |
% |
|
|
|
|
|
|
|||
Student loans |
|
|
50,549 |
|
|
54,319 |
|
(7 |
) % |
|
|
|
|
|
|
|||
_________________
(1) |
Within each loan product category, average loan balance is defined as the total unpaid principal balance of the loans divided by the number of loans that have a balance greater than zero dollars as of the reporting date. Average loan balance includes loans on the balance sheet and transferred loans with which SoFi has a continuing involvement through its servicing agreements. |
|
|
December 31, |
|
|
|||
Lending – Products |
|
2021 |
|
2020 |
|
% Change |
|
Home loans |
|
23,035 |
|
13,977 |
|
65 |
% |
Personal loans |
|
610,348 |
|
501,045 |
|
22 |
% |
Student loans |
|
445,569 |
|
402,623 |
|
11 |
% |
Total lending products |
|
1,078,952 |
|
917,645 |
|
18 |
% |
Technology Platform Segment Results
SoFi's Technology Platform segment consists primarily of Galileo Financial Technologies, LLC (Galileo), a technology infrastructure provider acquired in May 2020. Galileo signed nine new clients during the fourth quarter, for a full year 2021 total of 44. Client accounts enabled by Galileo rose 67% year-over-year, to approximately 100 million from approximately 60 million, through new client acquisition and growth at existing clients. Galileo has also expanded its client base to include B2B and enterprise clients, as adoption of modern digital payments and banking has opened up new verticals, client types, use cases and opportunities.
|
|
December 31, |
|
|
||
Technology Platform |
|
2021 |
|
2020 |
|
% Change |
Total accounts |
|
99,660,657 |
|
59,735,210 |
|
67 % |
Technology Platform segment net revenue of $53.3 million for the fourth quarter of 2021, and $194.9 million for the full year, was up 42% and 102%, respectively, from the comparable prior year periods. SoFi continues to invest heavily to capture Galileo’s significant and accelerating secular growth opportunities. This intentional increased investment drove quarterly Galileo operating expenses 61% higher year-over-year, and lowered the contribution margin from 45% to 38% in the fourth quarter. Maintaining this high level of investment for sustained, long-term growth is expected to require operating the business at a 20–30% contribution margin range for the foreseeable future.
Technology Platform – Segment Results of Operations |
|
|
|
|
|
|
||||||||||||||||
|
|
Three Months Ended December 31, |
|
|
|
Year Ended December 31, |
|
|
||||||||||||||
($ in thousands) |
|
|
2021 |
|
|
|
2020 |
|
|
% Change |
|
|
2021 |
|
|
|
2020 |
|
|
% Change |
||
Total net revenue |
|
$ |
53,299 |
|
|
$ |
37,482 |
|
|
42 |
% |
|
$ |
194,886 |
|
|
$ |
96,316 |
|
|
102 |
% |
Directly attributable expenses |
|
|
(33,291 |
) |
|
|
(20,676 |
) |
|
61 |
% |
|
|
(130,439 |
) |
|
|
(42,427 |
) |
|
207 |
% |
Contribution Profit |
|
$ |
20,008 |
|
|
$ |
16,806 |
|
|
19 |
% |
|
$ |
64,447 |
|
|
$ |
53,889 |
|
|
20 |
% |
Financial Services Segment Results
Fourth quarter 2021 net revenue of nearly $22.0 million was more than five times the prior year period's total of $4.1 million, demonstrating SoFi’s rapid progress in monetizing this segment. The Financial Services segment contribution loss of $35.2 million improved by $1.6 million from the prior year quarter's $36.8 million loss, due to the benefits of ongoing investments for growth. For the full year, the segment delivered $58.1 million of revenue, a nearly five-fold increase from the prior year’s $11.9 million total, and the $134.9 million contribution loss was essentially flat versus $132.1 million in the prior year period.
Financial Services – Segment Results of Operations |
|
|
|
|
|
|
||||||||||||||||
|
|
Three Months Ended December 31, |
|
|
|
Year Ended December 31, |
|
|
||||||||||||||
($ in thousands) |
|
|
2021 |
|
|
|
2020 |
|
|
% Change |
|
|
2021 |
|
|
|
2020 |
|
|
% Change |
||
Total net revenue |
|
$ |
21,956 |
|
|
$ |
4,051 |
|
|
442 |
% |
|
$ |
58,078 |
|
|
$ |
11,870 |
|
|
389 |
% |
Directly attributable expenses |
|
|
(57,145 |
) |
|
|
(40,804 |
) |
|
40 |
% |
|
|
(192,996 |
) |
|
|
(143,966 |
) |
|
34 |
% |
Contribution loss |
|
$ |
(35,189 |
) |
|
$ |
(36,753 |
) |
|
(4 |
) % |
|
$ |
(134,918 |
) |
|
$ |
(132,096 |
) |
|
2 |
% |
By continuously innovating for members with new and relevant offerings, features and rewards, SoFi added approximately 2.5 million Financial Services products in 2021, bringing the total to approximately 4.1 million. Triple-digit growth in SoFi Money and SoFi Invest products were the largest drivers of the 155% year-over-year increase in total Financial Services products. New SoFi Money features in 2021 include two-day early paycheck, autosave, cashback, and no-fee overdraft protection. SoFi's new SoFi Checking and Savings offering is truly differentiated in the category, with a 1% annual percentage yield for direct deposit members — 33 times the national average — and no minimum balance requirements, plus many of the free features SoFi Money members historically enjoyed.
SoFi Invest expanded member selection in both cryptocurrencies and retail IPOs in 2021. Two new crypto coin additions in the fourth quarter brought the full-year total added to 25, and the year-end total of 30 placed SoFi among the selection leaders in the space. SoFi Invest also brought two regular-way IPOs to members in the fourth quarter — as the primary retail channel for Rivian, the largest IPO since Facebook in 2012, and Nubank, a leading fintech company in Brazil. SoFi introduced stop-limit trade orders in the fourth quarter as well, and added margin trading in the first quarter of 2022. The SoFi Credit Card — with a unique Rewards platform that awards points for both transactions and smart financial behaviors — experienced strong take-up in its first full year. Total accounts grew from approximately 6,000 to more than 91,000 from the beginning through the end of 2021, and quarterly spend, balances and accounts averaged high double-digit growth throughout the year. In addition, SoFi’s partnership with Pagaya resulted in nearly 7,700 referred loans, a promising debut in its first full quarter.
|
|
December 31, |
|
|
||
Financial Services – Products |
|
2021 |
|
2020 |
|
% Change |
Money |
|
1,436,955 |
|
645,502 |
|
123 % |
Invest |
|
1,595,143 |
|
531,541 |
|
200 % |
Credit Card |
|
91,216 |
|
6,445 |
|
n/m |
Referred loans |
|
7,659 |
|
— |
|
n/m |
Relay |
|
930,181 |
|
408,735 |
|
128 % |
At Work |
|
33,091 |
|
13,687 |
|
142 % |
Total products |
|
4,094,245 |
|
1,605,910 |
|
155 % |
Subsequent Events
National Bank Charter Approval
A key element of SoFi’s long-term strategy has been to secure a national bank charter. In January 2022, SoFi received regulatory approval to become a bank holding company and to acquire Golden Pacific Bancorp, Inc., and its wholly-owned subsidiary, Golden Pacific Bank, National Association, a national bank (“Golden Pacific Bank”) (such acquisition, the “Bank Merger”). SoFi also received approval to change the composition of Golden Pacific Bank’s assets. The Bank Merger closed in February 2022, after which SoFi became a bank holding company and Golden Pacific Bank began operating as SoFi Bank.
Management's view is that operating as a bank holding company can enhance SoFi’s overall profitability. Management believes that moving from a reliance on third-party bank holding companies by operating under a national bank charter will allow SoFi to provide current and prospective members broader and more competitive options across their financial services needs, including deposit accounts and loan products, while lowering the overall cost to fund loans (by utilizing members’ deposits held at SoFi Bank instead of third parties to fund loans). This is expected to enable SoFi to offer lower interest rates on loans to members, as well as competitive interest rates on SoFi Checking and Savings accounts that elect direct deposit, without having to charge non-interest based fees. With the Bank Merger complete, SoFi has begun to transfer SoFi Money products to SoFi Bank, and intends to continue to transfer its Lending, SoFi Money and SoFi Credit Card products to SoFi Bank over time.
Technisys Acquisition
On February 22, 2022, SoFi Technologies, Inc. announced that it had entered into an agreement and plan of merger (the “Merger Agreement”) to acquire Technisys, a leading cloud-native, digital multi-product core banking platform, at a transaction value of approximately $1.1 billion. Technisys’ shareholders will receive a base consideration of approximately 84 million shares, subject to customary adjustments set forth in the terms of the Merger Agreement. The transaction is subject to satisfaction of certain closing conditions.
Management believes the acquisition of Technisys will provide a critical strategic asset, as both an attractive business, and an innovative technology advancing SoFi’s effort to build the AWS of Fintech and its ambition to provide best-of-breed products on a one-stop shop platform that meets all of its members’ financial needs. In management's view, combining Technisys’ Cyberbank platform with Galileo will create one of the most modern full-stack offerings available with multi-product capabilities — including deposit, checking, lending, credit cards and investing as well as future products — all surfaced through industry-leading APIs. In addition, it is believed that the growth opportunities of both Galileo and Technisys will expand meaningfully as a result of gaining access to each company's large installed client base. SoFi expects to also be able to leverage this next-generation technology stack to continue building its best-of-breed products and services by integrating Technisys’ leading, cloud-native, multi-product digital banking core with Galileo’s cloud-based platform-as-a-service capabilities.
Following the close of the acquisition, Technisys will continue to operate as an independent subsidiary of SoFi Technologies, Inc. and as part of its Technology Platform segment, with Miguel Santos continuing as CEO.
Guidance and Outlook
For note, management expects the incremental net interest income revenue from SoFi Bank to only contribute nominally to first quarter 2022 results, and prior to fully originating loans in SoFi Bank, which is currently expected in May 2022. When SoFi began operating SoFi Bank in February, it did not contribute any existing SoFi loans to SoFi Bank and initially capitalized SoFi Bank entirely with cash. Operations are still in transition to allow loan originations to occur from SoFi Bank. That transition is not expected to be fully complete until the end of May 2022.
Over the last several quarters, SoFi’s unique, diversified business model has proven to be an increasingly powerful competitive advantage. Even as SoFi continues to invest and scale, the expectation is for that strength and momentum to continue.
SoFi’s guidance for the first quarter of 2022 incorporates the negative impact of the unexpected extension of the federal student loan payment moratorium to May 1, 2022. Management estimates the negative impact to be approximately $30 to $35 million of revenue and $20 to $25 million of contribution profit in the first quarter, with the expectation that loan origination levels for the entire quarter will remain consistent with those of the first three quarters of 2021. Management expects to generate $280 to $285 million of adjusted net revenue in the first quarter of 2022, up 30% to 32% year-over-year, and up modestly sequentially, and $0 to $5 million of adjusted EBITDA.
Had the moratorium expired in January, management estimates that first quarter 2022 adjusted revenue would have been in the range of $310 to $320 million, and adjusted EBITDA would have been $20 to $30 million.
For the full year 2022, management expects to grow adjusted net revenue 55% year-over-year, to $1.57 billion, and deliver adjusted EBITDA of $180 million. Several recent developments factor into current full-year guidance:
- First, management assumes the moratorium on federal student loan payments expires as currently contemplated on May 1, 2022 and student loan refinance origination volume normalizes to pre-Covid levels partway through the second quarter, and remains at those levels from that point through the remainder of 2022.
- Second, management assumes that SoFi Bank will begin contributing to SoFi’s results more meaningfully in the second quarter of 2022, rather than in the first quarter, when SoFi Bank was opened. Because SoFi Bank was initially capitalized with cash from the balance sheet, not loans, SoFi will not begin to realize the lower cost of capital benefits of SoFi Bank until it can originate and fund loans in SoFi Bank. Management believes it will take until the second quarter of 2022 to build the appropriate loan balances to see more than a nominal impact.
- Third, management assumes that Technisys revenue growth will be 20% to 25% for full-year 2022, and will begin contributing to SoFi's results following the close of the transaction.
- Fourth, management expects the core SoFi business (excluding the impact of Technisys) to deliver incremental adjusted EBITDA margins of 30% in 2022, consistent with previously articulated plans to continue investing to drive sustainable long-term growth. Management expects Technisys to contribute a minimal amount to adjusted EBITDA in 2022, primarily because 2021 was a year of significant investment for Technisys. Over time, management expects the Technisys business to be additive to consolidated incremental adjusted EBITDA margins.
Management currently forecasts Stock-Based Compensation expense of $80 to $85 million for the first quarter of 2022 and $340 million for the full year.
Earnings Webcast
SoFi’s executive management team will host a live audio webcast beginning at 5:00 p.m. Eastern Time (2:00 p.m. Pacific Time) today to discuss the quarter’s financial results and business highlights. All interested parties are invited to listen to the live webcast at https://investors.sofi.com. A replay of the webcast will be available on the SoFi Investor Relations website for 30 days. Investor information, including supplemental financial information, is available on SoFi’s Investor Relations website at https://investors.sofi.com.
Cautionary Statement Regarding Forward-Looking Statements
Certain of the statements above are forward-looking and as such are not historical facts. This includes, without limitation, statements regarding the financial position, business strategy and the plans and objectives of management for our future operations. These forward-looking statements are not guarantees of performance. Such statements can be identified by the fact that they do not relate strictly to historical or current facts. Words such as “anticipate”, “believe”, “continue”, “could”, “estimate”, “expect”, “intend”, “may”, "opportunity", "future", "strategy", “might”, “plan”, “possible”, “potential”, “predict”, “project”, “should”, “strive”, “suggests”, “would”, “will be”, “will continue”, “will likely result” and similar expressions may identify forward-looking statements, but the absence of these words does not mean that a statement is not forward-looking. Factors that could cause actual results to differ materially from those contemplated by these forward-looking statements include: (i) the effect of and uncertainties related to the COVID-19 pandemic (including any government responses thereto); (ii) our ability to achieve and maintain profitability and continued growth across our three businesses in the future; (iii) the impact on our business of the regulatory environment and complexities with compliance related to such environment, including any further extension of the student loan payment moratorium and our expectations regarding the return to pre-pandemic student loan demand levels; (iv) our ability to realize the benefits of becoming a bank holding company and operating SoFi Bank; (v) our ability to respond and adapt to changing market and economic conditions, including inflationary pressures; (vi) our ability to continue to drive brand awareness and realize the benefits or our integrated multi-media marketing and advertising campaigns; (vii) our ability to vertically integrate our businesses and accelerate the pace of innovation of our financial products; (viii) our ability to manage our growth effectively and our expectations regarding the development and expansion of our business; (ix) our ability to access sources of capital, including debt financing and other sources of capital to finance operations and growth; (x) the success of our continued investments in our Financial Services segment and in our business generally; (xi) the success of our marketing efforts and our ability to expand our member base; (xii) our ability to maintain our leadership position in certain categories of our business and to grow market share in existing markets or any new markets we may enter; (xiii) our ability to develop new products, features and functionality that are competitive and meet market needs; (xiv) our ability to realize the benefits of our strategy, including what we refer to as our FSPL; (xv) our ability to make accurate credit and pricing decisions or effectively forecast our loss rates; (xvi) our ability to establish and maintain an effective system of internal controls over financial reporting; (xvii) our expectations with respect to our anticipated investment levels in our Technology Platform segment and our expected margins in that segment; (xviii) our ability to close the acquisition of Technisys and realize the anticipated benefits of such acquisition; and (xix) the outcome of any legal or governmental proceedings that may be instituted against us. The foregoing list of factors is not exhaustive. You should carefully consider the foregoing factors and the other risks and uncertainties set forth in the section titled “Risk Factors” in our last quarterly report on Form 10-Q, as filed with the Securities and Exchange Commission, and those that are included in any of our future filings with the Securities and Exchange Commission, including our annual report on Form 10-K, under the Exchange Act.
These forward-looking statements are based on information available as of the date hereof and current expectations, forecasts and assumptions, and involve a number of judgments, risks and uncertainties. Accordingly, forward-looking statements should not be relied upon as representing our views as of any subsequent date, and we do not undertake any obligation to update forward-looking statements to reflect events or circumstances after the date they were made, whether as a result of new information, future events or otherwise, except as may be required under applicable securities laws.
As a result of a number of known and unknown risks and uncertainties, our actual results or performance may be materially different from those expressed or implied by these forward-looking statements. You should not place undue reliance on these forward-looking statements.
Non-GAAP Financial Measures
This press release presents information about our adjusted net revenue and adjusted EBITDA, which are non-GAAP financial measures provided as supplements to the results provided in accordance with accounting principles generally accepted in the United States (GAAP). We use adjusted net revenue and adjusted EBITDA to evaluate our operating performance, formulate business plans, help better assess our overall liquidity position, and make strategic decisions, including those relating to operating expenses and the allocation of internal resources. Accordingly, we believe that adjusted net revenue and adjusted EBITDA provide useful information to investors and others in understanding and evaluating our operating results in the same manner as our management. These non-GAAP measures are presented for supplemental informational purposes only, have limitations as analytical tools, and should not be considered in isolation from, or as a substitute for, the analysis of other GAAP financial measures, such as total net revenue and net income (loss). Other companies may not use these non-GAAP measures or may use similar measures that are defined in a different manner. Therefore, SoFi's non-GAAP measures may not be directly comparable to similarly titled measures of other companies. Reconciliations of these non-GAAP measures to the most directly comparable GAAP financial measures are provided in Table 2 to the “Financial Tables” herein.
Forward-looking non-GAAP financial measures are presented without reconciliations of such forward-looking non-GAAP measures because the GAAP financial measures are not accessible on a forward-looking basis and reconciling information is not available without unreasonable effort due to the inherent difficulty in forecasting and quantifying certain amounts that are necessary for such reconciliations, including adjustments reflected in our reconciliation of historic non-GAAP financial measures, the amounts of which, based on historical experience, could be material.
About SoFi
SoFi's mission is to help our members achieve financial independence to realize their ambitions. Our products for borrowing, saving, spending, investing and protecting give our approximately three and a half million members fast access to tools to get their money right. SoFi membership comes with the key essentials for getting ahead, including career advisors and connection to a thriving community of like-minded, ambitious people. SoFi is also the naming rights partner of SoFi Stadium, home of the Los Angeles Chargers and the Los Angeles Rams. For more information, visit https://www.sofi.com or download our iOS and Android apps.
Availability of Other Information About SoFi
Investors and others should note that we communicate with our investors and the public using our website (www.sofi.com), the investor relations website (https://investors.sofi.com), and on social media (Twitter and LinkedIn), including but not limited to investor presentations and investor fact sheets, Securities and Exchange Commission filings, press releases, public conference calls and webcasts. The information that SoFi posts on these channels and websites could be deemed to be material information. As a result, SoFi encourages investors, the media, and others interested in SoFi to review the information that is posted on these channels, including the investor relations website, on a regular basis. This list of channels may be updated from time to time on SoFi’s investor relations website and may include additional social media channels. The contents of SoFi’s website or these channels, or any other website that may be accessed from its website or these channels, shall not be deemed incorporated by reference in any filing under the Securities Act of 1933, as amended.
FINANCIAL TABLES
1. Consolidated Statements of Operations and Comprehensive Loss
2. Reconciliation of GAAP to Non-GAAP Financial Measures
3. Consolidated Balance Sheets
4. Consolidated Statements of Cash Flows
5. Company Metrics
6. Segment Financials
Table 1 |
||||||||||||||||
SoFi Technologies, Inc. Consolidated Statements of Operations and Comprehensive Loss (In Thousands, Except for Share and Per Share Data) |
||||||||||||||||
|
|
|
|
|
||||||||||||
|
|
Three Months Ended December 31, |
|
Year Ended December 31, |
||||||||||||
|
|
|
2021 |
|
|
|
2020 |
|
|
|
2021 |
|
|
|
2020 |
|
Interest income |
|
|
|
|
|
|
|
|||||||||
Loans |
$ |
91,119 |
|
|
$ |
85,622 |
|
|
$ |
337,862 |
|
|
$ |
330,353 |
|
|
Securitizations |
|
2,849 |
|
|
|
5,133 |
|
|
|
14,109 |
|
|
|
24,031 |
|
|
Related party notes |
|
— |
|
|
|
480 |
|
|
|
211 |
|
|
|
3,189 |
|
|
Other |
|
815 |
|
|
|
838 |
|
|
|
2,838 |
|
|
|
5,964 |
|
|
Total interest income |
|
94,783 |
|
|
|
92,073 |
|
|
|
355,020 |
|
|
|
363,537 |
|
|
Interest expense |
|
|
|
|
|
|
|
|||||||||
Securitizations and warehouses |
|
15,067 |
|
|
|
33,669 |
|
|
|
90,485 |
|
|
|
155,150 |
|
|
Corporate borrowings |
|
2,593 |
|
|
|
19,125 |
|
|
|
10,345 |
|
|
|
27,974 |
|
|
Other |
|
546 |
|
|
|
456 |
|
|
|
1,946 |
|
|
|
2,482 |
|
|
Total interest expense |
|
18,206 |
|
|
|
53,250 |
|
|
|
102,776 |
|
|
|
185,606 |
|
|
Net interest income |
|
76,577 |
|
|
|
38,823 |
|
|
|
252,244 |
|
|
|
177,931 |
|
|
Noninterest income |
|
|
|
|
|
|
|
|||||||||
Loan origination and sales |
|
135,415 |
|
|
|
100,241 |
|
|
|
497,626 |
|
|
|
371,323 |
|
|
Securitizations |
|
(8,249 |
) |
|
|
(7,249 |
) |
|
|
(14,862 |
) |
|
|
(70,251 |
) |
|
Servicing |
|
9,594 |
|
|
|
(1,128 |
) |
|
|
(2,281 |
) |
|
|
(19,426 |
) |
|
Technology platform fees |
|
51,287 |
|
|
|
38,521 |
|
|
|
191,847 |
|
|
|
90,128 |
|
|
Other |
|
20,984 |
|
|
|
2,283 |
|
|
|
60,298 |
|
|
|
15,827 |
|
|
Total noninterest income |
|
209,031 |
|
|
|
132,668 |
|
|
|
732,628 |
|
|
|
387,601 |
|
|
Total net revenue |
|
285,608 |
|
|
|
171,491 |
|
|
|
984,872 |
|
|
|
565,532 |
|
|
Noninterest expense |
|
|
|
|
|
|
|
|||||||||
Technology and product development |
|
66,316 |
|
|
|
57,767 |
|
|
|
276,087 |
|
|
|
201,199 |
|
|
Sales and marketing |
|
129,705 |
|
|
|
72,182 |
|
|
|
426,875 |
|
|
|
276,577 |
|
|
Cost of operations |
|
69,195 |
|
|
|
53,010 |
|
|
|
256,980 |
|
|
|
178,896 |
|
|
General and administrative |
|
125,160 |
|
|
|
76,097 |
|
|
|
498,534 |
|
|
|
237,381 |
|
|
Provision for credit losses |
|
4,686 |
|
|
|
— |
|
|
|
7,573 |
|
|
|
— |
|
|
Total noninterest expense |
|
395,062 |
|
|
|
259,056 |
|
|
|
1,466,049 |
|
|
|
894,053 |
|
|
Loss before income taxes |
|
(109,454 |
) |
|
|
(87,565 |
) |
|
|
(481,177 |
) |
|
|
(328,521 |
) |
|
Income tax (expense) benefit |
|
(1,558 |
) |
|
|
4,949 |
|
|
|
(2,760 |
) |
|
|
104,468 |
|
|
Net loss |
$ |
(111,012 |
) |
|
$ |
(82,616 |
) |
|
$ |
(483,937 |
) |
|
$ |
(224,053 |
) |
|
Other comprehensive loss |
|
|
|
|
|
|
|
|||||||||
Unrealized losses on available-for-sale securities, net |
|
(1,201 |
) |
|
|
— |
|
|
|
(1,351 |
) |
|
|
— |
|
|
Foreign currency translation adjustments, net |
|
188 |
|
|
|
(126 |
) |
|
|
46 |
|
|
|
(145 |
) |
|
Total other comprehensive loss |
|
(1,013 |
) |
|
|
(126 |
) |
|
|
(1,305 |
) |
|
|
(145 |
) |
|
Comprehensive loss |
$ |
(112,025 |
) |
|
$ |
(82,742 |
) |
|
$ |
(485,242 |
) |
|
$ |
(224,198 |
) |
|
Loss per share |
|
|
|
|
|
|
|
|||||||||
Loss per share – basic |
$ |
(0.15 |
) |
|
$ |
(1.85 |
) |
|
$ |
(1.00 |
) |
|
$ |
(4.30 |
) |
|
Loss per share – diluted |
$ |
(0.15 |
) |
|
$ |
(1.85 |
) |
|
$ |
(1.00 |
) |
|
$ |
(4.30 |
) |
|
Weighted average common stock outstanding – basic |
|
814,507,200 |
|
|
|
78,480,471 |
|
|
|
526,730,261 |
|
|
|
73,851,108 |
|
|
Weighted average common stock outstanding – diluted |
|
814,507,200 |
|
|
|
78,480,471 |
|
|
|
526,730,261 |
|
|
|
73,851,108 |
|
|
Table 2 |
Non-GAAP Financial Measures |
Reconciliation of Adjusted Net Revenue
Adjusted net revenue is defined as total net revenue, adjusted to exclude the fair value changes in servicing rights and residual interests classified as debt due to valuation inputs and assumptions changes, which relate only to our Lending segment. For our consolidated results and for the Lending segment, we reconcile adjusted net revenue to total net revenue, the most directly comparable GAAP measure, as presented for the periods indicated below:
|
|
Three Months Ended December 31, |
|
Year Ended December 31, |
|||||||||
($ in thousands) |
|
|
2021 |
|
|
2020 |
|
2021 |
|
2020 |
|||
Total net revenue |
|
$ |
285,608 |
|
|
$ |
171,491 |
|
$ |
984,872 |
|
$ |
565,532 |
Servicing rights – change in valuation inputs or assumptions(1) |
|
|
(9,273 |
) |
|
|
1,127 |
|
|
2,651 |
|
|
17,459 |
Residual interests classified as debt – change in valuation inputs or assumptions(2) |
|
|
3,541 |
|
|
|
9,401 |
|
|
22,802 |
|
|
38,216 |
Adjusted net revenue |
|
$ |
279,876 |
|
|
$ |
182,019 |
|
$ |
1,010,325 |
|
$ |
621,207 |
|
|
Three Months Ended December 31, |
|
Year Ended December 31, |
|||||||||
($ in thousands) |
|
|
2021 |
|
|
2020 |
|
2021 |
|
2020 |
|||
Total net revenue – Lending |
|
$ |
213,764 |
|
|
$ |
148,992 |
|
$ |
738,323 |
|
$ |
480,866 |
Servicing rights – change in valuation inputs or assumptions(1) |
|
|
(9,273 |
) |
|
|
1,127 |
|
|
2,651 |
|
|
17,459 |
Residual interests classified as debt – change in valuation inputs or assumptions(2) |
|
|
3,541 |
|
|
|
9,401 |
|
|
22,802 |
|
|
38,216 |
Adjusted net revenue – Lending |
|
$ |
208,032 |
|
|
$ |
159,520 |
|
$ |
763,776 |
|
$ |
536,541 |
___________________
(1) |
Reflects changes in fair value inputs and assumptions on servicing rights, including conditional prepayment and default rates and discount rates. These assumptions are highly sensitive to market interest rate changes and are not indicative of our performance or results of operations. Moreover, these non-cash charges are unrealized during the period and, therefore, have no impact on our cash flows from operations. As such, these positive and negative changes are adjusted out of total net revenue to provide management and financial users with better visibility into the net revenue available to finance our operations and our overall performance. |
|
(2) |
Reflects changes in fair value inputs and assumptions on residual interests classified as debt, including conditional prepayment and default rates and discount rates. When third parties finance our consolidated securitization variable interest entities (“VIEs”) by purchasing residual interests, we receive proceeds at the time of the closing of the securitization and, thereafter, pass along contractual cash flows to the residual interest owner. These residual debt obligations are measured at fair value on a recurring basis, but they have no impact on our initial financing proceeds, our future obligations to the residual interest owner (because future residual interest claims are limited to contractual securitization collateral cash flows), or the general operations of our business. As such, these positive and negative non-cash changes in fair value attributable to assumption changes are adjusted out of total net revenue to provide management and financial users with better visibility into the net revenue available to finance our operations. |
Reconciliation of Adjusted EBITDA
Adjusted EBITDA is defined as net income (loss), adjusted to exclude: (i) corporate borrowing-based interest expense (our adjusted EBITDA measure is not adjusted for warehouse or securitization-based interest expense, nor deposit interest expense and finance lease liability interest expense, as discussed further below), (ii) income tax expense (benefit), (iii) depreciation and amortization, (iv) share-based expense (inclusive of equity-based payments to non-employees), (v) transaction-related expenses, (vi) fair value changes in warrant liabilities, and (vii) fair value changes in each of servicing rights and residual interests classified as debt due to valuation assumptions. We reconcile adjusted EBITDA to net loss, the most directly comparable GAAP measure, for the periods indicated below:
|
|
Three Months Ended December 31, |
|
Year Ended December 31, |
||||||||||||
($ in thousands) |
|
|
2021 |
|
|
|
2020 |
|
|
|
2021 |
|
|
|
2020 |
|
Net loss |
|
$ |
(111,012 |
) |
|
$ |
(82,616 |
) |
|
$ |
(483,937 |
) |
|
$ |
(224,053 |
) |
Non-GAAP adjustments: |
|
|
|
|
|
|
|
|
||||||||
Interest expense – corporate borrowings(1) |
|
|
2,593 |
|
|
|
19,125 |
|
|
|
10,345 |
|
|
|
27,974 |
|
Income tax expense (benefit)(2) |
|
|
1,558 |
|
|
|
(4,949 |
) |
|
|
2,760 |
|
|
|
(104,468 |
) |
Depreciation and amortization(3) |
|
|
26,527 |
|
|
|
25,486 |
|
|
|
101,568 |
|
|
|
69,832 |
|
Share-based expense |
|
|
77,082 |
|
|
|
30,089 |
|
|
|
239,371 |
|
|
|
100,778 |
|
Transaction-related expense(4) |
|
|
2,753 |
|
|
|
— |
|
|
|
27,333 |
|
|
|
9,161 |
|
Fair value changes in warrant liabilities(5) |
|
|
10,824 |
|
|
|
14,154 |
|
|
|
107,328 |
|
|
|
20,525 |
|
Servicing rights – change in valuation inputs or assumptions(6) |
|
|
(9,273 |
) |
|
|
1,127 |
|
|
|
2,651 |
|
|
|
17,459 |
|
Residual interests classified as debt – change in valuation inputs or assumptions(7) |
|
|
3,541 |
|
|
|
9,401 |
|
|
|
22,802 |
|
|
|
38,216 |
|
Total adjustments |
|
|
115,605 |
|
|
|
94,433 |
|
|
|
514,158 |
|
|
|
179,477 |
|
Adjusted EBITDA |
|
$ |
4,593 |
|
|
$ |
11,817 |
|
|
$ |
30,221 |
|
|
$ |
(44,576 |
) |
___________________
(1) |
Our adjusted EBITDA measure adjusts for corporate borrowing-based interest expense, as these expenses are a function of our capital structure. Corporate borrowing-based interest expense primarily included (i) interest on our revolving credit facility, (ii) amortization of debt discount and debt issuance costs on our convertible notes, and (iii) interest on the seller note issued in connection with our acquisition of Galileo. Our adjusted EBITDA measure does not adjust for interest expense on warehouse facilities and securitization debt, which are recorded within interest expense—securitizations and warehouses in the consolidated statements of operations and comprehensive income (loss), as these interest expenses are direct operating expenses driven by loan origination and sales activity. Additionally, our adjusted EBITDA measure does not adjust for interest expense on SoFi Money deposits or interest expense on our finance lease liability in connection with SoFi Stadium, which are recorded within interest expense—other, as these interest expenses are direct operating expenses driven by SoFi Money deposits and finance leases, respectively. The fluctuations in interest expense were impacted by interest expense on the Galileo seller note, which was issued in May 2020 and repaid in February 2021, as well as the amortization of debt discount and debt issuance costs on our convertible notes, which were issued in October 2021. Revolving credit facility interest expense decreased modestly during 2021 relative to 2020, as a higher average balance in 2021 was more than offset by a decrease in LIBOR, and increased during 2020 relative to 2019 primarily due to a higher average balance following the acquisition of Galileo. |
|
(2) |
Our income tax expense positions in 2021 and 2019 were primarily a function of SoFi Lending Corp.’s profitability in state jurisdictions where separate filings are required. Our income tax benefit position in 2020 was primarily due to a partial release of our valuation allowance in the second quarter in connection with deferred tax liabilities resulting from intangible assets acquired from Galileo in May 2020. |
|
(3) |
Depreciation and amortization expense for 2021 increased compared to 2020 primarily due to the amortization of intangible assets recognized during the second quarter of 2020 associated with the Galileo and 8 Limited acquisitions, amortization of purchased and internally-developed software, and depreciation related to SoFi Stadium fixed assets, partially offset by a decrease related to the acceleration of core banking infrastructure amortization. Depreciation and amortization expense for 2020 compared to 2019 increased primarily due to amortization expense on intangible assets acquired during the second quarter of 2020 from Galileo and 8 Limited, acceleration of core banking infrastructure amortization, and amortization of purchased and internally-developed software. |
|
(4) |
Transaction-related expenses during 2021 included a $21.2 million special payment to the Series 1 preferred stockholders in conjunction with the Business Combination and financial advisory and professional costs associated with transactions that occurred during the period. We incurred such costs as follows: (i) $2.2 million related to our acquisition of Golden Pacific Bank, (ii) $3.3 million related to a recently announced acquisition, and (iii) $0.6 million related to debt and equity transactions, including our convertible debt, capped call and secondary offering on behalf of certain investors. During 2020, transaction-related expenses included certain costs, such as financial advisory and professional services costs, associated with our acquisitions of Galileo and 8 Limited. |
|
(5) |
Our adjusted EBITDA measure excludes the non-cash fair value changes in warrants accounted for as liabilities, which were measured at fair value through earnings. The amounts in 2019 and 2020, as well as a portion of 2021, related to changes in the fair value of Series H warrants issued by Social Finance in 2019 in connection with certain redeemable preferred stock issuances. We did not measure the Series H warrants at fair value subsequent to May 28, 2021 in conjunction with the Business Combination, as they were reclassified into permanent equity. In addition, in conjunction with the Business Combination, SoFi Technologies assumed certain common stock warrants (“SoFi Technologies warrants”) that were accounted for as liabilities and measured at fair value on a recurring basis. The fair value of the SoFi Technologies warrants was based on the closing price of ticker SOFIW and, therefore, fluctuated based on market activity. The vast majority of outstanding SoFi Technologies warrants were exercised during the fourth quarter of 2021, and therefore the Company incurred gains and losses associated with fair value changes until the warrant liabilities converted into SoFi common stock. The remaining unexercised warrants were redeemed at a redemption price of $0.10 on December 6, 2021. |
|
(6) |
Reflects changes in fair value inputs and assumptions, including market servicing costs, conditional prepayment and default rates and discount rates. This non-cash change is unrealized during the period and, therefore, has no impact on our cash flows from operations. As such, these positive and negative changes in fair value attributable to assumption changes are adjusted out of net loss to provide management and financial users with better visibility into the earnings available to finance our operations. |
|
(7) |
Reflects changes in fair value inputs and assumptions, including conditional prepayment and default rates and discount rates. When third parties finance our consolidated VIEs through purchasing residual interests, we receive proceeds at the time of the securitization close and, thereafter, pass along contractual cash flows to the residual interest owner. These obligations are measured at fair value on a recurring basis, which has no impact on our initial financing proceeds, our future obligations to the residual interest owner (because future residual interest claims are limited to contractual securitization collateral cash flows), or the general operations of our business. As such, these positive and negative non-cash changes in fair value attributable to assumption changes are adjusted out of net loss to provide management and financial users with better visibility into the earnings available to finance our operations. |
Table 3 |
||||||||
SoFi Technologies, Inc. Consolidated Balance Sheets (In Thousands, Except for Share Data) |
||||||||
|
December 31, |
|||||||
|
|
2021 |
|
|
|
2020 |
|
|
Assets |
|
|
|
|||||
Cash and cash equivalents |
$ |
494,711 |
|
|
$ |
872,582 |
|
|
Restricted cash and restricted cash equivalents |
|
273,726 |
|
|
|
450,846 |
|
|
Investments in available-for-sale securities (amortized cost of $195,796 and $0, respectively) |
|
194,907 |
|
|
|
— |
|
|
Loans, less allowance for credit losses on loans at amortized cost of $7,037 and $219, respectively |
|
6,068,884 |
|
|
|
4,879,303 |
|
|
Servicing rights |
|
168,259 |
|
|
|
149,597 |
|
|
Securitization investments |
|
374,688 |
|
|
|
496,935 |
|
|
Equity method investments |
|
19,739 |
|
|
|
107,534 |
|
|
Property, equipment and software |
|
111,873 |
|
|
|
81,489 |
|
|
Goodwill |
|
898,527 |
|
|
|
899,270 |
|
|
Intangible assets |
|
284,579 |
|
|
|
355,086 |
|
|
Operating lease right-of-use assets |
|
115,191 |
|
|
|
116,858 |
|
|
Related party notes receivable |
|
— |
|
|
|
17,923 |
|
|
Other assets, less allowance for credit losses of $2,292 and $562, respectively |
|
171,242 |
|
|
|
136,076 |
|
|
Total assets |
$ |
9,176,326 |
|
|
$ |
8,563,499 |
|
|
Liabilities, temporary equity and permanent equity (deficit) |
|
|
|
|||||
Liabilities: |
|
|
|
|||||
Accounts payable, accruals and other liabilities |
$ |
298,164 |
|
|
$ |
452,909 |
|
|
Operating lease liabilities |
|
138,794 |
|
|
|
139,796 |
|
|
Debt |
|
3,947,983 |
|
|
|
4,798,925 |
|
|
Residual interests classified as debt |
|
93,682 |
|
|
|
118,298 |
|
|
Total liabilities |
|
4,478,623 |
|
|
|
5,509,928 |
|
|
Commitments, guarantees, concentrations and contingencies |
|
|
|
|||||
Temporary equity: |
|
|
|
|||||
Redeemable preferred stock, $0.00 par value: 100,000,000 and 570,562,965 shares authorized; 3,234,000 and 469,150,522 shares issued and outstanding as of December 31, 2021 and 2020, respectively |
|
320,374 |
|
|
|
3,173,686 |
|
|
Permanent equity (deficit): |
|
|
|
|||||
Common stock, $0.00 par value: 3,100,000,000 and 789,167,056 shares authorized; 828,154,462 and 115,084,358 shares issued and outstanding as of December 31, 2021 and 2020, respectively |
|
83 |
|
|
|
— |
|
|
Additional paid-in capital |
|
5,561,831 |
|
|
|
579,228 |
|
|
Accumulated other comprehensive loss |
|
(1,471 |
) |
|
|
(166 |
) |
|
Accumulated deficit |
|
(1,183,114 |
) |
|
|
(699,177 |
) |
|
Total permanent equity (deficit) |
|
4,377,329 |
|
|
|
(120,115 |
) |
|
Total liabilities, temporary equity and permanent equity (deficit) |
$ |
9,176,326 |
|
|
$ |
8,563,499 |
|
|
Table 4 |
||||||||
SoFi Technologies, Inc. Consolidated Statements of Cash Flows (In Thousands) |
||||||||
|
|
|
||||||
|
|
Year Ended December 31, |
||||||
|
|
|
2021 |
|
|
|
2020 |
|
Operating activities |
|
|
|
|||||
Net loss |
$ |
(483,937 |
) |
|
$ |
(224,053 |
) |
|
Adjustments to reconcile net loss to net cash used in operating activities: |
|
|
|
|||||
Depreciation and amortization |
|
101,568 |
|
|
|
69,832 |
|
|
Deferred debt issuance and discount expense |
|
18,292 |
|
|
|
28,310 |
|
|
Share-based compensation expense |
|
239,011 |
|
|
|
99,870 |
|
|
Equity-based payments to non-employees |
|
360 |
|
|
|
908 |
|
|
Deferred income taxes |
|
1,204 |
|
|
|
(104,504 |
) |
|
Equity method investment earnings |
|
261 |
|
|
|
(4,314 |
) |
|
Accretion of seller note interest expense |
|
— |
|
|
|
6,002 |
|
|
Fair value changes in residual interests classified as debt |
|
22,802 |
|
|
|
38,216 |
|
|
Fair value changes in securitization investments |
|
(6,538 |
) |
|
|
(13,919 |
) |
|
Fair value changes in warrant liabilities |
|
107,328 |
|
|
|
20,525 |
|
|
Fair value adjustment to related party notes receivable |
|
(169 |
) |
|
|
319 |
|
|
Other |
|
(5,085 |
) |
|
|
803 |
|
|
Changes in operating assets and liabilities: |
|
|
|
|||||
Originations and purchases of loans |
|
(13,500,706 |
) |
|
|
(10,406,813 |
) |
|
Proceeds from sales and repayments of loans |
|
12,202,525 |
|
|
|
9,949,805 |
|
|
Other changes in loans |
|
(10,148 |
) |
|
|
(58,743 |
) |
|
Servicing assets |
|
(18,662 |
) |
|
|
52,021 |
|
|
Related party notes receivable interest income |
|
1,399 |
|
|
|
1,121 |
|
|
Other assets |
|
(10,700 |
) |
|
|
(29,883 |
) |
|
Accounts payable, accruals and other liabilities |
|
(9,022 |
) |
|
|
95,161 |
|
|
Net cash used in operating activities |
$ |
(1,350,217 |
) |
|
$ |
(479,336 |
) |
|
Investing activities |
|
|
|
|||||
Purchases of property, equipment, software and intangible assets |
$ |
(52,261 |
) |
|
$ |
(24,549 |
) |
|
Related party notes receivable issuances |
|
— |
|
|
|
(7,643 |
) |
|
Proceeds from repayment of related party notes receivable |
|
16,693 |
|
|
|
— |
|
|
Purchases of available-for-sale investments |
|
(246,372 |
) |
|
|
— |
|
|
Proceeds from sales of available-for-sale investments |
|
52,742 |
|
|
|
— |
|
|
Proceeds from maturities of available-for-sale investments |
|
4,799 |
|
|
|
— |
|
|
Purchases of non-securitization investments |
|
(22,000 |
) |
|
|
(145 |
) |
|
Proceeds from non-securitization investments |
|
109,534 |
|
|
|
974 |
|
|
Proceeds from securitization investments |
|
247,058 |
|
|
|
322,704 |
|
|
Acquisition of business, net of cash acquired |
|
— |
|
|
|
(32,392 |
) |
|
Net cash provided by investing activities |
$ |
110,193 |
|
|
$ |
258,949 |
|
|
SoFi Technologies, Inc. Consolidated Statements of Cash Flows (Continued) (In Thousands) |
||||||||
|
|
|
||||||
|
|
Year Ended December 31, |
||||||
|
|
|
2021 |
|
|
|
2020 |
|
Financing activities |
|
|
|
|||||
Proceeds from debt issuances |
$ |
9,521,314 |
|
|
$ |
10,234,378 |
|
|
Repayment of debt |
|
(10,429,176 |
) |
|
|
(9,708,991 |
) |
|
Payment of debt issuance costs |
|
(9,465 |
) |
|
|
(16,443 |
) |
|
Purchase of capped calls |
|
(113,760 |
) |
|
|
— |
|
|
Taxes paid related to net share settlement of share-based awards |
|
(42,644 |
) |
|
|
(31,259 |
) |
|
Purchases of common stock |
|
(526 |
) |
|
|
(40 |
) |
|
Redemptions of redeemable common and preferred stock |
|
(282,859 |
) |
|
|
— |
|
|
Proceeds from Business Combination and PIPE Investment |
|
1,989,851 |
|
|
|
— |
|
|
Payment of costs directly attributable to the issuance of common stock in connection with Business Combination and PIPE Investment |
|
(26,951 |
) |
|
|
— |
|
|
Proceeds from stock option exercises |
|
25,154 |
|
|
|
3,781 |
|
|
Proceeds from warrant exercises |
|
95,047 |
|
|
|
— |
|
|
Payment of redeemable preferred stock dividends |
|
(40,426 |
) |
|
|
(40,536 |
) |
|
Payment of deferred equity costs |
|
(56 |
) |
|
|
— |
|
|
Finance lease principal payments |
|
(516 |
) |
|
|
(489 |
) |
|
Note receivable principal repayments from stockholder |
|
— |
|
|
|
43,513 |
|
|
Proceeds from common stock issuances |
|
— |
|
|
|
369,840 |
|
|
Net cash provided by financing activities |
$ |
684,987 |
|
|
$ |
853,754 |
|
|
Effect of exchange rates on cash and cash equivalents |
|
46 |
|
|
|
(145 |
) |
|
Net (decrease) increase in cash, cash equivalents, restricted cash and restricted cash equivalents |
|
(554,991 |
) |
|
|
633,222 |
|
|
Cash, cash equivalents, restricted cash and restricted cash equivalents at beginning of period |
|
1,323,428 |
|
|
|
690,206 |
|
|
Cash, cash equivalents, restricted cash and restricted cash equivalents at end of period |
$ |
768,437 |
|
|
$ |
1,323,428 |
|
|
|
|
|
|
|||||
Reconciliation to amounts on consolidated balance sheets (as of period end) |
|
|
|
|||||
Cash and cash equivalents |
$ |
494,711 |
|
|
$ |
872,582 |
|
|
Restricted cash and restricted cash equivalents |
|
273,726 |
|
|
|
450,846 |
|
|
Total cash, cash equivalents, restricted cash and restricted cash equivalents |
$ |
768,437 |
|
|
$ |
1,323,428 |
|
|
|
|
|
|
|||||
SoFi Technologies, Inc. Consolidated Statements of Cash Flows (Continued) (In Thousands) |
||||||
|
|
|
||||
|
|
Year Ended December 31, |
||||
|
|
2021 |
|
2020 |
||
Supplemental cash flow information |
|
|
|
|||
Interest paid |
$ |
94,795 |
|
$ |
129,131 |
|
Income taxes paid, net |
|
1,759 |
|
|
529 |
|
|
|
|
|
|||
Supplemental non-cash investing and financing activities |
|
|
|
|||
Securitization investments acquired via loan transfers |
$ |
118,274 |
|
$ |
151,768 |
|
Non-cash property, equipment, software and intangible asset additions |
|
1,930 |
|
|
358 |
|
Available-for-sale investments securities purchased but unpaid |
|
7,457 |
|
|
— |
|
Share-based compensation capitalized related to internally-developed software |
|
7,776 |
|
|
— |
|
Third party warrants acquired with earnings initially deferred |
|
964 |
|
|
— |
|
Deferred debt issuance costs accrued but unpaid |
|
925 |
|
|
1,600 |
|
Costs directly attributable to the issuance of common stock paid in 2020 |
|
588 |
|
|
— |
|
Reduction to temporary equity associated with purchase price adjustments |
|
743 |
|
|
— |
|
Conversion of temporary equity into permanent equity in conjunction with the Business Combination |
|
2,702,569 |
|
|
— |
|
Deconsolidation of residual interests classified as debt |
|
— |
|
|
101,718 |
|
Deconsolidation of securitization debt |
|
— |
|
|
770,918 |
|
Seller note issued in acquisition |
|
— |
|
|
243,998 |
|
Redeemable preferred stock issued in acquisition |
|
— |
|
|
814,156 |
|
Common stock options assumed in acquisition |
|
— |
|
|
32,197 |
|
Issuance of common stock in acquisition |
|
— |
|
|
15,565 |
|
Finance lease right-of-use assets acquired |
|
— |
|
|
15,100 |
|
Property, equipment and software acquired in acquisition |
|
— |
|
|
2,026 |
|
Debt assumed in acquisition |
|
— |
|
|
5,832 |
|
Accrued but unpaid deferred equity costs |
|
— |
|
|
56 |
|
Redeemed but unpaid common stock |
|
— |
|
|
526 |
|
Redeemed but unpaid redeemable preferred stock |
|
— |
|
|
132,859 |
|
Table 5 |
|||||||||||||||
Company Metrics |
|||||||||||||||
|
December 31, 2021 |
|
September 30, 2021 |
|
June 30,
|
|
March 31, 2021 |
|
December 31, 2020 |
|
September 30, 2020 |
|
June 30,
|
|
March 31, 2020 |
Members |
3,460,298 |
|
2,937,379 |
|
2,560,492 |
|
2,281,092 |
|
1,850,871 |
|
1,500,576 |
|
1,204,475 |
|
1,086,409 |
Total Products |
5,173,197 |
|
4,267,665 |
|
3,667,121 |
|
3,184,554 |
|
2,523,555 |
|
2,052,933 |
|
1,645,044 |
|
1,442,481 |
Total Products — Lending segment |
1,078,952 |
|
1,030,882 |
|
981,440 |
|
945,227 |
|
917,645 |
|
892,934 |
|
861,970 |
|
841,615 |
Total Products — Financial Services segment |
4,094,245 |
|
3,236,783 |
|
2,685,681 |
|
2,239,327 |
|
1,605,910 |
|
1,159,999 |
|
783,074 |
|
600,866 |
Total Accounts — Technology Platform segment(1) |
99,660,657 |
|
88,811,022 |
|
78,902,156 |
|
69,572,680 |
|
59,735,210 |
|
49,276,594 |
|
35,988,090 |
|
— |
___________________
(1) |
Beginning in the fourth quarter of 2021, the Company included SoFi accounts on the Galileo platform-as-a-service in its total Technology Platform accounts metric to better align with presentation of Technology Platform segment revenue. The Company recast the total accounts as of December 31, 2020 to conform to the current year presentation, which resulted in an increase of 375,367 in total accounts as of such date. Quarterly amounts for the relevant quarters in 2021 and 2020 were determined to be immaterial, and as such were not recast. |
Members
We refer to our customers as “members”. We define a member as someone who has had a lending relationship with us through origination and/or servicing, opened a financial services account, linked an external account to our platform, or signed up for our credit score monitoring service. Once someone becomes a member, they are always considered a member unless they violate our terms of service, given that our members have continuous access to our certified financial planners, our career advice services, our member events, our content, educational material, news, tools and calculators at no cost to the member. We view members as an indication not only of the size and a measurement of growth of our business, but also as a measure of the significant value of the data we have collected over time.
Products
Total products refers to the aggregate number of lending and financial services products that our members have selected on our platform since our inception through the reporting date, whether or not the members are still registered for such products. In our Lending segment, total products refers to the number of home loans, personal loans and student loans that have been originated through our platform through the reporting date, whether or not such loans have been paid off. If a member has multiple loan products of the same loan product type, such as two personal loans, that is counted as a single product. However, if a member has multiple loan products across loan product types, such as one personal loan and one home loan, that is counted as two products. In our Financial Services segment, total products refers to the number of SoFi Money accounts, SoFi Invest accounts, SoFi Credit Card accounts (including accounts with a zero dollar balance at the reporting date), SoFi At Work accounts and SoFi Relay accounts (with either credit score monitoring enabled or external linked accounts) that have been opened through our platform through the reporting date. Our SoFi Invest service is composed of three products: active investing accounts, robo-advisory accounts and cryptocurrency accounts. Our members can select any one or combination of the three types of SoFi Invest products. If a member has multiple SoFi Invest products of the same account type, such as two active investing accounts, that is counted as a single product. However, if a member has multiple SoFi Invest products across account types, such as one active investing account and one robo-advisory account, those separate account types are considered separate products. Total products is a primary indicator of the size and reach of our Lending and Financial Services segments. Management relies on total products metrics to understand the effectiveness of our member acquisition efforts and to gauge the propensity for members to use more than one product.
Technology Platform Total Accounts
In our Technology Platform segment, total accounts refers to the number of open accounts at Galileo as of the reporting date, excluding SoFi accounts. We exclude SoFi accounts because revenue generated by Galileo from the SoFi relationship is eliminated in consolidation. No information is reported prior to our acquisition of Galileo on May 14, 2020. Total accounts is a primary indicator of the accounts dependent upon Galileo’s technology platform to use virtual card products, virtual wallets, make peer-to-peer and bank-to-bank transfers, receive early paychecks, separate savings from spending balances, make debit transactions and rely upon real-time authorizations, all of which result in technology platform fees for the Technology Platform segment.
Table 6 |
||||||||||||||||||||||||||||||||
Segment Financials |
||||||||||||||||||||||||||||||||
|
|
Quarter Ended |
||||||||||||||||||||||||||||||
($ in thousands) |
|
December 31, 2021 |
|
September 30, 2021 |
|
June 30, 2021 |
|
March 31, 2021 |
|
December 31, 2020 |
|
September 30, 2020 |
|
June 30, 2020 |
|
March 31, 2020 |
||||||||||||||||
Lending |
|
|
|
|
|
|
|
|
|
|
|
|
|
|
|
|
||||||||||||||||
Total interest income |
|
$ |
91,999 |
|
|
$ |
91,579 |
|
|
$ |
83,035 |
|
|
$ |
81,547 |
|
|
$ |
90,753 |
|
|
$ |
86,468 |
|
|
$ |
83,985 |
|
|
$ |
93,177 |
|
Total interest expense |
|
|
(14,753 |
) |
|
|
(19,322 |
) |
|
|
(26,213 |
) |
|
|
(29,770 |
) |
|
|
(33,626 |
) |
|
|
(34,246 |
) |
|
|
(39,650 |
) |
|
|
(47,516 |
) |
Total noninterest income (loss) |
|
|
136,518 |
|
|
|
138,034 |
|
|
|
109,469 |
|
|
|
96,200 |
|
|
|
91,865 |
|
|
|
109,890 |
|
|
|
51,549 |
|
|
|
28,217 |
|
Total net revenue |
|
|
213,764 |
|
|
|
210,291 |
|
|
|
166,291 |
|
|
|
147,977 |
|
|
|
148,992 |
|
|
|
162,112 |
|
|
|
95,884 |
|
|
|
73,878 |
|
Adjusted net revenue(1) |
|
|
208,032 |
|
|
|
215,475 |
|
|
|
172,232 |
|
|
|
168,037 |
|
|
|
159,520 |
|
|
|
178,084 |
|
|
|
117,182 |
|
|
|
81,755 |
|
Contribution profit (loss) |
|
|
105,065 |
|
|
|
117,668 |
|
|
|
89,188 |
|
|
|
87,686 |
|
|
|
85,204 |
|
|
|
103,011 |
|
|
|
49,419 |
|
|
|
4,095 |
|
Technology Platform |
|
|
|
|
|
|
|
|
|
|
|
|
|
|
|
|
||||||||||||||||
Total interest income (expense) |
|
$ |
— |
|
|
$ |
39 |
|
|
$ |
(32 |
) |
|
$ |
(36 |
) |
|
$ |
(42 |
) |
|
$ |
(47 |
) |
|
$ |
(18 |
) |
|
$ |
— |
|
Total noninterest income |
|
|
53,299 |
|
|
|
50,186 |
|
|
|
45,329 |
|
|
|
46,101 |
|
|
|
37,524 |
|
|
|
38,865 |
|
|
|
19,037 |
|
|
|
997 |
|
Total net revenue(2) |
|
|
53,299 |
|
|
|
50,225 |
|
|
|
45,297 |
|
|
|
46,065 |
|
|
|
37,482 |
|
|
|
38,818 |
|
|
|
19,019 |
|
|
|
997 |
|
Contribution profit |
|
|
20,008 |
|
|
|
15,741 |
|
|
|
13,013 |
|
|
|
15,685 |
|
|
|
16,806 |
|
|
|
23,986 |
|
|
|
12,100 |
|
|
|
997 |
|
Financial Services |
|
|
|
|
|
|
|
|
|
|
|
|
|
|
|
|
||||||||||||||||
Total interest income |
|
$ |
2,523 |
|
|
$ |
1,651 |
|
|
$ |
893 |
|
|
$ |
540 |
|
|
$ |
378 |
|
|
$ |
365 |
|
|
$ |
316 |
|
|
$ |
1,737 |
|
Total interest expense |
|
|
(738 |
) |
|
|
(442 |
) |
|
|
(351 |
) |
|
|
(311 |
) |
|
|
(290 |
) |
|
|
(267 |
) |
|
|
(233 |
) |
|
|
(1,522 |
) |
Total noninterest income |
|
|
20,171 |
|
|
|
11,411 |
|
|
|
16,497 |
|
|
|
6,234 |
|
|
|
3,963 |
|
|
|
3,139 |
|
|
|
2,345 |
|
|
|
1,939 |
|
Total net revenue |
|
|
21,956 |
|
|
|
12,620 |
|
|
|
17,039 |
|
|
|
6,463 |
|
|
|
4,051 |
|
|
|
3,237 |
|
|
|
2,428 |
|
|
|
2,154 |
|
Contribution loss(2) |
|
|
(35,189 |
) |
|
|
(39,465 |
) |
|
|
(24,745 |
) |
|
|
(35,519 |
) |
|
|
(36,753 |
) |
|
|
(37,467 |
) |
|
|
(30,893 |
) |
|
|
(26,983 |
) |
Other(3) |
|
|
|
|
|
|
|
|
|
|
|
|
|
|
|
|
||||||||||||||||
Total interest income |
|
$ |
261 |
|
|
$ |
371 |
|
|
$ |
180 |
|
|
$ |
441 |
|
|
$ |
942 |
|
|
$ |
1,284 |
|
|
$ |
1,764 |
|
|
$ |
2,368 |
|
Total interest expense |
|
|
(2,715 |
) |
|
|
(1,501 |
) |
|
|
(1,500 |
) |
|
|
(5,131 |
) |
|
|
(19,292 |
) |
|
|
(4,345 |
) |
|
|
(3,417 |
) |
|
|
(1,095 |
) |
Total noninterest income (loss) |
|
|
(957 |
) |
|
|
— |
|
|
|
3,967 |
|
|
|
169 |
|
|
|
(684 |
) |
|
|
(319 |
) |
|
|
(726 |
) |
|
|
— |
|
Total net revenue (loss)(2) |
|
|
(3,411 |
) |
|
|
(1,130 |
) |
|
|
2,647 |
|
|
|
(4,521 |
) |
|
|
(19,034 |
) |
|
|
(3,380 |
) |
|
|
(2,379 |
) |
|
|
1,273 |
|
Consolidated |
|
|
|
|
|
|
|
|
|
|
|
|
|
|
|
|
||||||||||||||||
Total interest income |
|
$ |
94,783 |
|
|
$ |
93,601 |
|
|
$ |
84,108 |
|
|
$ |
82,528 |
|
|
$ |
92,073 |
|
|
$ |
88,117 |
|
|
$ |
86,065 |
|
|
$ |
97,282 |
|
Total interest expense |
|
|
(18,206 |
) |
|
|
(21,226 |
) |
|
|
(28,096 |
) |
|
|
(35,248 |
) |
|
|
(53,250 |
) |
|
|
(38,905 |
) |
|
|
(43,318 |
) |
|
|
(50,133 |
) |
Total noninterest income (loss) |
|
|
209,031 |
|
|
|
199,631 |
|
|
|
175,262 |
|
|
|
148,704 |
|
|
|
132,668 |
|
|
|
151,575 |
|
|
|
72,205 |
|
|
|
31,153 |
|
Total net revenue |
|
|
285,608 |
|
|
|
272,006 |
|
|
|
231,274 |
|
|
|
195,984 |
|
|
|
171,491 |
|
|
|
200,787 |
|
|
|
114,952 |
|
|
|
78,302 |
|
Adjusted net revenue(1) |
|
|
279,876 |
|
|
|
277,190 |
|
|
|
237,215 |
|
|
|
216,044 |
|
|
|
182,019 |
|
|
|
216,759 |
|
|
|
136,250 |
|
|
|
86,179 |
|
Net income (loss) |
|
|
(111,012 |
) |
|
|
(30,047 |
) |
|
|
(165,314 |
) |
|
|
(177,564 |
) |
|
|
(82,616 |
) |
|
|
(42,878 |
) |
|
|
7,808 |
|
|
|
(106,367 |
) |
Adjusted EBITDA(1) |
|
|
4,593 |
|
|
|
10,256 |
|
|
|
11,240 |
|
|
|
4,132 |
|
|
|
11,817 |
|
|
|
33,509 |
|
|
|
(23,750 |
) |
|
|
(66,152 |
) |
___________________
(1) |
Adjusted net revenue and adjusted EBITDA are non-GAAP financial measures. For additional information on these measures and reconciliations to the most directly comparable GAAP measures, see “Non-GAAP Financial Measures” and Table 2 to the “Financial Tables” herein. |
|
(2) |
Technology Platform segment total net revenue includes intercompany technology platform fees earned by Galileo from SoFi, which is a Galileo client, of $1,863 and $686 for the years ended December 31, 2021 and 2020, respectively. The prior year information was recast to conform to the current year presentation and the intercompany amounts were reflected in the fourth quarters of the respective years, as inter-quarter amounts were determined to be immaterial. There is an equal and offsetting expense reflected within the Financial Services segment contribution loss representing the intercompany technology platform fees incurred to Galileo. The intercompany revenue and expense are eliminated in consolidation. The revenue is eliminated within “Other” and the expense represents a reconciling item of segment contribution profit (loss) to consolidated loss before income taxes. |
|
(3) |
“Other” primarily includes total net revenue associated with corporate functions and non-recurring gains from non-securitization investing activities that are not directly related to a reportable segment. |
SOFI-F
