

TEMPE, Ariz.--(BUSINESS WIRE)--NortonLifeLock Inc. (NASDAQ: NLOK), a global leader in consumer Cyber Safety, today reported results for its fiscal year 2021 fourth quarter which ended April 2, 2021.
Q4 GAAP Financial Results YoY
Q4 GAAP revenue was $672 million, up 9% in USD. Q4 GAAP operating margin was 39.6%, up 32 points. Q4 GAAP diluted EPS from continuing operations was $0.35, up 52%. Q4 operating cash flow was $356 million.
Q4 Non-GAAP Financial Highlights and Commentary YoY
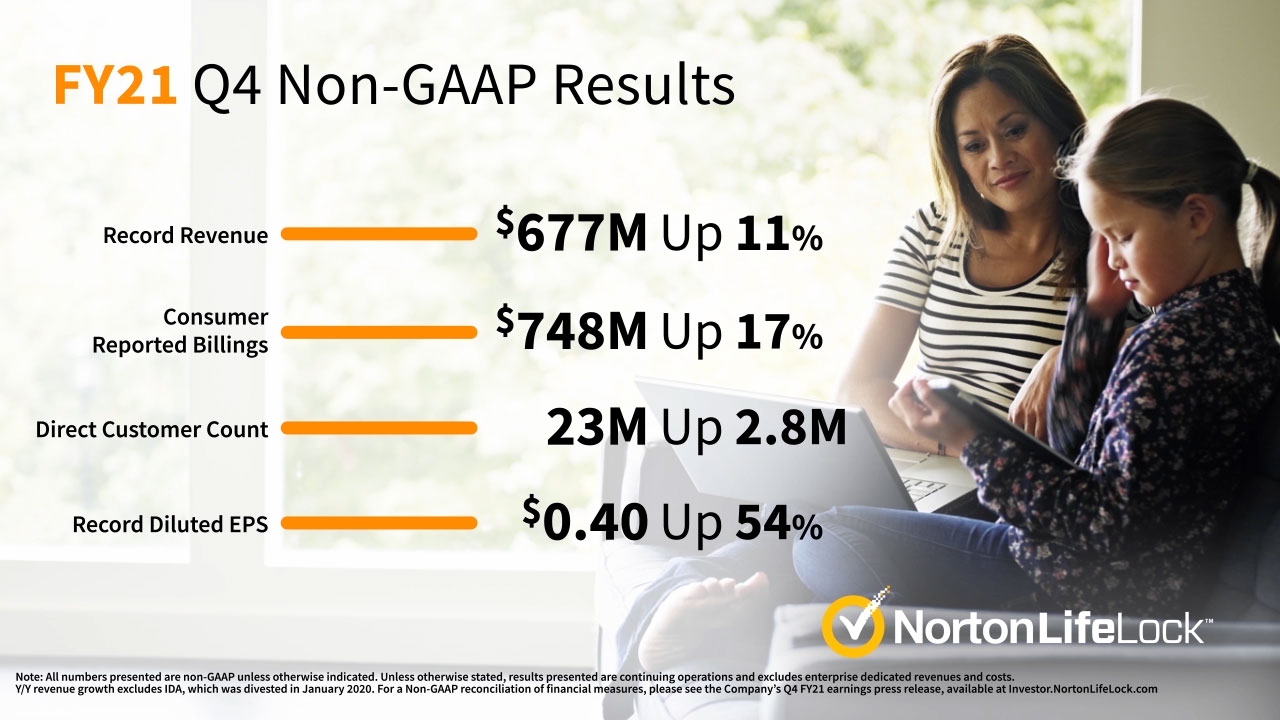
- Record revenue of $677 million, up 11% in USD
- Record diluted EPS of $0.40, up 54%
- Operating margin was 50.5%, up 900 bps
- Consumer reported billings was $748 million, up 17% in USD
- Direct customer count of 23 million, up 2.8 million
“We’re on a mission to bring Cyber Safety to everyone,” said Vincent Pilette, CEO of NortonLifeLock. “I’m proud of what the team achieved in our first fiscal year. We accelerated growth, expanded our international footprint, and added freemium capability. In the fourth quarter alone, we added 2 million new customers, and achieved record revenue and profit. This is possible because we are all driven by our vision to protect and empower people to live their digital lives safely. We are just getting started.”
Fiscal 2022 Q1 Guidance
- Non-GAAP Revenue is expected to be in the range of $680 to $690 million, translating to approximately 10 to 12% growth YoY
- Non-GAAP EPS is expected to be in the range of $0.40 to $0.42
Quarterly Cash Dividend
NortonLifeLock’s Board of Directors has declared a quarterly cash dividend of $0.125 per common share to be paid on June 23, 2021, to all shareholders of record as of the close of business on June 09, 2021.
Share Repurchase Authorization Raised by $1.5 Billion
NortonLifeLock’s Board of Directors has approved an incremental share repurchase authorization of $1.5 billion. Along with the current $274 million authorization remaining, this new authorization increases the total share repurchase remaining to approximately $1.8 billion. The authorization has no expiration date. As of April 2, 2021, the Company has returned $1.33 billion to shareholders through the repurchase of 58 million common shares since becoming a standalone company in November 2019.
Amended Existing Credit Facilities Agreement
On May 7, 2021, NortonLifeLock entered into the first amendment of the Company’s existing credit agreement, which provides a credit facility of up to $1.0 billion and a term loan facility of up to $1.75 billion. The new credit facility increases borrowing capacity by $516 million. The credit facilities will remain senior secured and mature in May 2026. Following the amendment, the Company’s leverage ratio remains at 2.0x net debt to adjusted EBITDA.
2021 Investor Day: Transforming for Growth
NortonLifeLock will host its first annual Investor Day today, May 10, 2021.
Virtual event details Investor.NortonLifeLock.com
- May 10, 2021: Watch-on-Demand presentations available after market close at 2 p.m. PT / 5 p.m. ET.
- May 11, 2021: Live video Q&A webcast with leadership team at 9 a.m. PT / 12 p.m. ET.
For additional details regarding NortonLifeLock’s results and outlook, please see the Earnings Presentation and the Supplemental Information on the investor relations page of our website at Investor.NortonLifeLock.com.
About NortonLifeLock Inc.
NortonLifeLock Inc. (NASDAQ: NLOK) is a global leader in consumer Cyber Safety, protecting and empowering people to live their digital lives safely. We are the consumer’s trusted ally in an increasingly complex and connected world. Learn more about how we’re transforming Cyber Safety at www.NortonLifeLock.com.
Forward-Looking Statements
This press release contains statements which may be considered forward-looking within the meaning of the U.S. federal securities laws. In some cases, you can identify these forward-looking statements by the use of terms such as “expect,” “will,” “continue,” or similar expressions, and variations or negatives of these words, but the absence of these words does not mean that a statement is not forward-looking. All statements other than statements of historical fact are statements that could be deemed forward-looking statements, including, but not limited to: the statements under “Fiscal 2022 Q1 Guidance,” including expectations relating to first quarter non-GAAP revenue, non-GAAP revenue growth and non-GAAP EPS; the statements contained in the quotations; and any statements of assumptions underlying any of the foregoing. These statements are subject to known and unknown risks, uncertainties and other factors that may cause our actual results, levels of activity, performance or achievements to differ materially from results expressed or implied in this press release. Such risk factors include, but are not limited to, those related to: the current and future impact of the COVID-19 pandemic on the Company’s business and industry; the effect of the sale of substantially all of the Enterprise Security assets on NortonLifeLock’s retained businesses and products; retention of executive leadership team members; difficulties in improving sales and product development during leadership transitions; difficulties in executing the operating model for the consumer cyber safety business; lower than anticipated returns from the Company's investments in direct customer acquisition; difficulties and delays in reducing run rate expenses and monetizing underutilized assets; general business and economic conditions; matters arising out of our completed Audit Committee investigation and the ongoing U.S. Securities and Exchange Commission investigation; fluctuations and volatility in NortonLifeLock’s stock price; the ability of NortonLifeLock to successfully execute strategic plans; the ability to maintain customer and partner relationships; the ability of NortonLifeLock to achieve its cost and operating efficiency goals; the anticipated growth of certain market segments; NortonLifeLock’s sales and business strategy; fluctuations in tax rates and foreign currency exchange rates; the potential for corporate tax increases under the new Biden Administration; the timing and market acceptance of new product releases and upgrades; and the successful development of new products and the degree to which these products gain market acceptance. Additional information concerning these and other risk factors is contained in the Risk Factors sections of NortonLifeLock’s most recent reports on Form 10-K and Form 10-Q. NortonLifeLock assumes no obligation, and does not intend, to update these forward-looking statements as a result of future events or developments.
Use of Non-GAAP Financial Information
We use non-GAAP measures of operating margin, net income and earnings per share, which are adjusted from results based on GAAP and exclude certain expenses, gains and losses. We also provide the non-GAAP metrics of Consumer revenues, constant currency revenues and Consumer reported billings, which exclude revenues from our divested ID Analytics solutions, and free cash flow, which is defined as cash flows from operating activities less purchases of property and equipment. These non-GAAP financial measures are provided to enhance the user’s understanding of our past financial performance and our prospects for the future. Our management team uses these non-GAAP financial measures in assessing NortonLifeLock’s performance, as well as in planning and forecasting future periods. These non-GAAP financial measures are not computed according to GAAP and the methods we use to compute them may differ from the methods used by other companies. Non-GAAP financial measures are supplemental, should not be considered a substitute for financial information presented in accordance with GAAP and should be read only in conjunction with our consolidated financial statements prepared in accordance with GAAP. Readers are encouraged to review the reconciliation of our non-GAAP financial measures to the comparable GAAP results, which is attached to our quarterly earnings release and which can be found, along with other financial information including the Supplemental Information, on the investor relations page of our website at Investor.NortonLifeLock.com. No reconciliation of the forecasted range for non-GAAP EPS guidance is included in this release because most non-GAAP adjustments pertain to events that have not yet occurred. It would be unreasonably burdensome to forecast, therefore we are unable to provide an accurate estimate.
| NORTONLIFELOCK INC. | ||||||||
Condensed Consolidated Balance Sheets |
||||||||
(In millions, unaudited) |
||||||||
|
April 2, 2021 |
|
April 3, 2020 |
|||||
ASSETS |
||||||||
Current assets: |
|
|
|
|||||
Cash and cash equivalents |
$ |
933 |
|
|
|
$ |
2,177 |
|
Short-term investments |
18 |
|
|
|
86 |
|
||
Accounts receivable, net |
117 |
|
|
|
111 |
|
||
Other current assets |
237 |
|
|
|
435 |
|
||
Assets held for sale |
233 |
|
|
|
270 |
|
||
Total current assets |
1,538 |
|
|
|
3,079 |
|
||
Property and equipment, net |
78 |
|
|
|
238 |
|
||
Operating lease assets |
76 |
|
|
|
88 |
|
||
Intangible assets, net |
1,116 |
|
|
|
1,067 |
|
||
Goodwill |
2,867 |
|
|
|
2,585 |
|
||
Other long-term assets |
686 |
|
|
|
678 |
|
||
Total assets |
$ |
6,361 |
|
|
|
$ |
7,735 |
|
LIABILITIES AND STOCKHOLDERS’ EQUITY (DEFICIT) |
||||||||
Current liabilities: |
|
|
|
|||||
Accounts payable |
$ |
52 |
|
|
|
$ |
87 |
|
Accrued compensation and benefits |
107 |
|
|
|
115 |
|
||
Current portion of long-term debt |
313 |
|
|
|
756 |
|
||
Contract liabilities |
1,210 |
|
|
|
1,049 |
|
||
Current operating lease liabilities |
26 |
|
|
|
28 |
|
||
Other current liabilities |
428 |
|
|
|
587 |
|
||
Total current liabilities |
2,136 |
|
|
|
2,622 |
|
||
Long-term debt |
3,288 |
|
|
|
3,465 |
|
||
Long-term contract liabilities |
55 |
|
|
|
27 |
|
||
Deferred income tax liabilities |
137 |
|
|
|
149 |
|
||
Long-term income taxes payable |
1,119 |
|
|
|
1,310 |
|
||
Long-term operating lease liabilities |
66 |
|
|
|
73 |
|
||
Other long-term liabilities |
60 |
|
|
|
79 |
|
||
Total liabilities |
6,861 |
|
|
|
7,725 |
|
||
Total stockholders’ equity (deficit) |
(500 |
) |
|
|
10 |
|
||
Total liabilities and stockholders’ equity (deficit) |
$ |
6,361 |
|
|
|
$ |
7,735 |
|
| NORTONLIFELOCK INC. | |||||||||||||||||||
Condensed Consolidated Statements of Operations (1) |
|||||||||||||||||||
(In millions, except per share data, unaudited) |
|||||||||||||||||||
|
Three Months Ended |
|
Year Ended |
||||||||||||||||
|
April 2, 2021 |
|
April 3, 2020 |
|
April 2, 2021 |
|
April 3, 2020 |
||||||||||||
Net revenues |
$ |
672 |
|
|
|
$ |
614 |
|
|
|
$ |
2,551 |
|
|
|
$ |
2,490 |
|
|
Cost of revenues |
99 |
|
|
|
97 |
|
|
|
362 |
|
|
|
393 |
|
|
||||
Gross profit |
573 |
|
|
|
517 |
|
|
|
2,189 |
|
|
|
2,097 |
|
|
||||
Operating expenses: |
|
|
|
|
|
|
|
||||||||||||
Sales and marketing |
148 |
|
|
|
150 |
|
|
|
576 |
|
|
|
701 |
|
|
||||
Research and development |
68 |
|
|
|
70 |
|
|
|
267 |
|
|
|
328 |
|
|
||||
General and administrative |
52 |
|
|
|
97 |
|
|
|
215 |
|
|
|
368 |
|
|
||||
Amortization of intangible assets |
20 |
|
|
|
18 |
|
|
|
74 |
|
|
|
79 |
|
|
||||
Restructuring and other costs |
19 |
|
|
|
138 |
|
|
|
161 |
|
|
|
266 |
|
|
||||
Total operating expenses |
307 |
|
|
|
473 |
|
|
|
1,293 |
|
|
|
1,742 |
|
|
||||
Operating income |
266 |
|
|
|
44 |
|
|
|
896 |
|
|
|
355 |
|
|
||||
Interest expense |
(35 |
) |
|
|
(50 |
) |
|
|
(144 |
) |
|
|
(196 |
) |
|
||||
Other income, net |
58 |
|
|
|
263 |
|
|
|
120 |
|
|
|
660 |
|
|
||||
Income from continuing operations before income taxes |
289 |
|
|
|
257 |
|
|
|
872 |
|
|
|
819 |
|
|
||||
Income tax expense |
81 |
|
|
|
108 |
|
|
|
176 |
|
|
|
241 |
|
|
||||
Income from continuing operations |
208 |
|
|
|
149 |
|
|
|
696 |
|
|
|
578 |
|
|
||||
Income (loss) from discontinued operations |
(14 |
) |
|
|
82 |
|
|
|
(142 |
) |
|
|
3,309 |
|
|
||||
Net income |
$ |
194 |
|
|
|
$ |
231 |
|
|
|
$ |
554 |
|
|
|
$ |
3,887 |
|
|
|
|
|
|
|
|
|
|
||||||||||||
Income (loss) per share - basic: |
|
|
|
|
|
|
|
||||||||||||
Continuing operations |
$ |
0.36 |
|
|
|
$ |
0.25 |
|
|
|
$ |
1.18 |
|
|
|
$ |
0.94 |
|
|
Discontinued operations |
$ |
(0.02 |
) |
|
|
$ |
0.14 |
|
|
|
$ |
(0.24 |
) |
|
|
$ |
5.38 |
|
|
Net income per share - basic (2) |
$ |
0.33 |
|
|
|
$ |
0.39 |
|
|
|
$ |
0.94 |
|
|
|
$ |
6.32 |
|
|
|
|
|
|
|
|
|
|
||||||||||||
Income (loss) per share - diluted: |
|
|
|
|
|
|
|
||||||||||||
Continuing operations |
$ |
0.35 |
|
|
|
$ |
0.23 |
|
|
|
$ |
1.16 |
|
|
|
$ |
0.90 |
|
|
Discontinued operations |
$ |
(0.02 |
) |
|
|
$ |
0.13 |
|
|
|
$ |
(0.24 |
) |
|
|
$ |
5.15 |
|
|
Net income per share - diluted (2) |
$ |
0.33 |
|
|
|
$ |
0.36 |
|
|
|
$ |
0.92 |
|
|
|
$ |
6.05 |
|
|
|
|
|
|
|
|
|
|
||||||||||||
Weighted-average shares outstanding: |
|
|
|
|
|
|
|
||||||||||||
Basic |
582 |
|
|
|
599 |
|
|
|
589 |
|
|
|
615 |
|
|
||||
Diluted |
587 |
|
|
|
639 |
|
|
|
600 |
|
|
|
643 |
|
|
||||
| __________________ | ||
(1) |
The year ended April 2, 2021 consisted of 52 weeks, whereas the year ended April 3, 2020 consisted of 53 weeks. The impact of the extra week on revenues in the year ended April 3, 2020 is estimated to be approximately $44 million. |
|
(2) |
Net income per share amounts may not add due to rounding. |
|
NORTONLIFELOCK INC. |
|||||||||||||||||||
Condensed Consolidated Statements of Cash Flows |
|||||||||||||||||||
(In millions, unaudited) |
|||||||||||||||||||
|
Three Months Ended |
|
Year Ended |
||||||||||||||||
|
April 2, 2021 |
|
April 3, 2020 |
|
April 2, 2021 |
|
April 3, 2020 |
||||||||||||
OPERATING ACTIVITIES: |
|
|
|
|
|
|
|
||||||||||||
Net income |
$ |
194 |
|
|
|
$ |
231 |
|
|
|
$ |
554 |
|
|
|
$ |
3,887 |
|
|
Adjustments: |
|
|
|
|
|
|
|
||||||||||||
Amortization and depreciation |
37 |
|
|
|
54 |
|
|
|
150 |
|
|
|
361 |
|
|
||||
Impairments of current and long-lived assets |
2 |
|
|
|
42 |
|
|
|
90 |
|
|
|
74 |
|
|
||||
Stock-based compensation expense |
15 |
|
|
|
42 |
|
|
|
81 |
|
|
|
312 |
|
|
||||
Deferred income taxes |
(5 |
) |
|
|
2 |
|
|
|
42 |
|
|
|
16 |
|
|
||||
Gain on extinguishment of debt |
— |
|
|
|
— |
|
|
|
(20 |
) |
|
|
— |
|
|
||||
Loss from equity interest |
— |
|
|
|
— |
|
|
|
— |
|
|
|
31 |
|
|
||||
Gain on divestitures |
— |
|
|
|
(262 |
) |
|
|
— |
|
|
|
(5,684 |
) |
|
||||
Gain on sale of equity method investment |
— |
|
|
|
— |
|
|
|
— |
|
|
|
(379 |
) |
|
||||
Gain on sale of properties |
(63 |
) |
|
|
— |
|
|
|
(98 |
) |
|
|
— |
|
|
||||
Non-cash operating lease expense |
5 |
|
|
|
8 |
|
|
|
22 |
|
|
|
40 |
|
|
||||
Other |
(2 |
) |
|
|
(31 |
) |
|
|
52 |
|
|
|
(4 |
) |
|
||||
Changes in operating assets and liabilities, net of acquisitions: |
|
|
|
|
|
|
|
||||||||||||
Accounts receivable, net |
2 |
|
|
|
46 |
|
|
|
3 |
|
|
|
583 |
|
|
||||
Accounts payable |
(21 |
) |
|
|
(40 |
) |
|
|
(44 |
) |
|
|
(61 |
) |
|
||||
Accrued compensation and benefits |
15 |
|
|
|
(18 |
) |
|
|
(10 |
) |
|
|
(117 |
) |
|
||||
Contract liabilities |
97 |
|
|
|
42 |
|
|
|
118 |
|
|
|
(121 |
) |
|
||||
Income taxes payable |
49 |
|
|
|
(1,713 |
) |
|
|
(299 |
) |
|
|
383 |
|
|
||||
Other assets |
108 |
|
|
|
13 |
|
|
|
144 |
|
|
|
(81 |
) |
|
||||
Other liabilities |
(77 |
) |
|
|
(182 |
) |
|
|
(79 |
) |
|
|
(101 |
) |
|
||||
Net cash provided by (used in) operating activities |
356 |
|
|
|
(1,766 |
) |
|
|
706 |
|
|
|
(861 |
) |
|
||||
INVESTING ACTIVITIES: |
|
|
|
|
|
|
|
||||||||||||
Purchases of property and equipment |
(1 |
) |
|
|
(3 |
) |
|
|
(6 |
) |
|
|
(89 |
) |
|
||||
Payments for acquisitions, net of cash acquired |
(344 |
) |
|
|
— |
|
|
|
(344 |
) |
|
|
— |
|
|
||||
Proceeds from divestitures, net of cash contributed and transaction costs |
— |
|
|
|
346 |
|
|
|
— |
|
|
|
10,918 |
|
|
||||
Proceeds from the maturities and sales of short-term investments |
8 |
|
|
|
32 |
|
|
|
68 |
|
|
|
167 |
|
|
||||
Proceeds from sales of properties |
100 |
|
|
|
— |
|
|
|
218 |
|
|
|
— |
|
|
||||
Proceeds from sale of equity method investment |
— |
|
|
|
2 |
|
|
|
— |
|
|
|
380 |
|
|
||||
Other |
4 |
|
|
|
11 |
|
|
|
(5 |
) |
|
|
3 |
|
|
||||
Net cash provided by (used in) investing activities |
(233 |
) |
|
|
388 |
|
|
|
(69 |
) |
|
|
11,379 |
|
|
||||
FINANCING ACTIVITIES: |
|
|
|
|
|
|
|
||||||||||||
Repayments of debt and related equity component |
(12 |
) |
|
|
(566 |
) |
|
|
(1,941 |
) |
|
|
(868 |
) |
|
||||
Proceeds from issuance of debt, net of issuance costs |
— |
|
|
|
— |
|
|
|
750 |
|
|
|
300 |
|
|
||||
Net proceeds from sales of common stock under employee stock incentive plans |
8 |
|
|
|
14 |
|
|
|
24 |
|
|
|
123 |
|
|
||||
Tax payments related to restricted stock units |
(1 |
) |
|
|
(7 |
) |
|
|
(58 |
) |
|
|
(78 |
) |
|
||||
Dividends and dividend equivalents paid |
(73 |
) |
|
|
(7,304 |
) |
|
|
(373 |
) |
|
|
(7,481 |
) |
|
||||
Repurchase of common stock |
(166 |
) |
|
|
(677 |
) |
|
|
(304 |
) |
|
|
(1,581 |
) |
|
||||
Cash consideration paid in exchange of convertible debt |
— |
|
|
|
(546 |
) |
|
|
— |
|
|
|
(546 |
) |
|
||||
Short-swing profit disgorgement |
— |
|
|
|
— |
|
|
|
— |
|
|
|
9 |
|
|
||||
Other |
(1 |
) |
|
|
— |
|
|
|
(1 |
) |
|
|
(1 |
) |
|
||||
Net cash used in financing activities |
(245 |
) |
|
|
(9,086 |
) |
|
|
(1,903 |
) |
|
|
(10,123 |
) |
|
||||
Effect of exchange rate fluctuations on cash and cash equivalents |
9 |
|
|
|
(8 |
) |
|
|
22 |
|
|
|
(9 |
) |
|
||||
Change in cash and cash equivalents |
(113 |
) |
|
|
(10,472 |
) |
|
|
(1,244 |
) |
|
|
386 |
|
|
||||
Beginning cash and cash equivalents |
1,046 |
|
|
|
12,649 |
|
|
|
2,177 |
|
|
|
1,791 |
|
|
||||
Ending cash and cash equivalents |
$ |
933 |
|
|
|
$ |
2,177 |
|
|
|
$ |
933 |
|
|
|
$ |
2,177 |
|
|
NORTONLIFELOCK INC. |
|||||||||||||||||||
Reconciliation of Selected GAAP Measures to Non-GAAP Measures (1) (2) |
|||||||||||||||||||
(In millions, except per share data, unaudited) |
|||||||||||||||||||
|
Three Months Ended |
|
Year Ended |
||||||||||||||||
|
April 2, 2021 |
|
April 3, 2020 |
|
April 2, 2021 |
|
April 3, 2020 |
||||||||||||
Operating income |
$ |
266 |
|
|
|
$ |
44 |
|
|
|
$ |
896 |
|
|
|
$ |
355 |
|
|
Contract liabilities fair value adjustment |
5 |
|
|
|
— |
|
|
|
5 |
|
|
|
— |
|
|
||||
Stock-based compensation |
13 |
|
|
|
28 |
|
|
|
71 |
|
|
|
119 |
|
|
||||
Amortization of intangible assets |
31 |
|
|
|
25 |
|
|
|
105 |
|
|
|
109 |
|
|
||||
Restructuring and other costs |
19 |
|
|
|
138 |
|
|
|
161 |
|
|
|
266 |
|
|
||||
Acquisition and integration costs |
3 |
|
|
|
— |
|
|
|
4 |
|
|
|
— |
|
|
||||
Litigation settlement charges |
4 |
|
|
|
20 |
|
|
|
29 |
|
|
|
20 |
|
|
||||
Other |
1 |
|
|
|
— |
|
|
|
— |
|
|
|
— |
|
|
||||
Operating income (Non-GAAP) |
$ |
342 |
|
|
|
$ |
255 |
|
|
|
$ |
1,271 |
|
|
|
$ |
869 |
|
|
|
|
|
|
|
|
|
|
||||||||||||
Operating margin |
39.6 |
|
% |
|
7.2 |
|
% |
|
35.1 |
|
% |
|
14.3 |
|
% |
||||
Operating margin (Non-GAAP) |
50.5 |
|
% |
|
41.5 |
|
% |
|
49.7 |
|
% |
|
34.9 |
|
% |
||||
|
|
|
|
|
|
|
|
||||||||||||
Net income |
$ |
194 |
|
|
|
$ |
231 |
|
|
|
$ |
554 |
|
|
|
$ |
3,887 |
|
|
Adjustments to income from continuing operations: |
|
|
|
|
|
|
|
||||||||||||
Contract liabilities fair value adjustment |
5 |
|
|
|
— |
|
|
|
5 |
|
|
|
— |
|
|
||||
Stock-based compensation |
13 |
|
|
|
26 |
|
|
|
70 |
|
|
|
120 |
|
|
||||
Amortization of intangible assets |
31 |
|
|
|
25 |
|
|
|
105 |
|
|
|
109 |
|
|
||||
Restructuring and other costs |
19 |
|
|
|
138 |
|
|
|
161 |
|
|
|
266 |
|
|
||||
Acquisition and integration costs |
3 |
|
|
|
— |
|
|
|
4 |
|
|
|
— |
|
|
||||
Litigation settlement charges |
4 |
|
|
|
20 |
|
|
|
29 |
|
|
|
20 |
|
|
||||
Other |
5 |
|
|
|
(1 |
) |
|
|
2 |
|
|
|
(1 |
) |
|
||||
Non-cash interest expense |
2 |
|
|
|
5 |
|
|
|
9 |
|
|
|
23 |
|
|
||||
Gain on divestitures and sale of equity method investment |
— |
|
|
|
(250 |
) |
|
|
— |
|
|
|
(629 |
) |
|
||||
Gain on extinguishment of debt |
— |
|
|
|
— |
|
|
|
(20 |
) |
|
|
— |
|
|
||||
Loss from equity method investment |
— |
|
|
|
— |
|
|
|
— |
|
|
|
31 |
|
|
||||
Gain on sale of properties |
(63 |
) |
|
|
— |
|
|
|
(98 |
) |
|
|
— |
|
|
||||
Total adjustments to GAAP income from continuing operations before income taxes |
19 |
|
|
|
(38 |
) |
|
|
267 |
|
|
|
(61 |
) |
|
||||
Adjustment to GAAP provision for income taxes |
7 |
|
|
|
56 |
|
|
|
(97 |
) |
|
|
59 |
|
|
||||
Total adjustment to continuing operations, net of taxes |
26 |
|
|
|
18 |
|
|
|
170 |
|
|
|
(2 |
) |
|
||||
Discontinued operations |
14 |
|
|
|
(82 |
) |
|
|
142 |
|
|
|
(3,309 |
) |
|
||||
Net income (Non-GAAP) |
$ |
234 |
|
|
|
$ |
167 |
|
|
|
$ |
866 |
|
|
|
$ |
576 |
|
|
|
|
|
|
|
|
|
|
||||||||||||
Diluted net income per share |
$ |
0.33 |
|
|
|
$ |
0.36 |
|
|
|
$ |
0.92 |
|
|
|
$ |
6.05 |
|
|
Adjustments to diluted net income per share: |
|
|
|
|
|
|
|
||||||||||||
Contract liabilities fair value adjustment |
0.01 |
|
|
|
— |
|
|
|
0.01 |
|
|
|
— |
|
|
||||
Stock-based compensation |
0.02 |
|
|
|
0.04 |
|
|
|
0.12 |
|
|
|
0.19 |
|
|
||||
Amortization of intangible assets |
0.05 |
|
|
|
0.04 |
|
|
|
0.18 |
|
|
|
0.17 |
|
|
||||
Restructuring and other costs |
0.03 |
|
|
|
0.22 |
|
|
|
0.27 |
|
|
|
0.41 |
|
|
||||
Acquisition and integration costs |
0.01 |
|
|
|
— |
|
|
|
0.01 |
|
|
|
— |
|
|
||||
Litigation settlement charges |
0.01 |
|
|
|
0.03 |
|
|
|
0.05 |
|
|
|
0.03 |
|
|
||||
Other |
0.01 |
|
|
|
— |
|
|
|
— |
|
|
|
— |
|
|
||||
Non-cash interest expense |
— |
|
|
|
0.01 |
|
|
|
0.02 |
|
|
|
0.04 |
|
|
||||
Gain on divestitures and sale of equity method investment |
— |
|
|
|
(0.39 |
) |
|
|
— |
|
|
|
(0.98 |
) |
|
||||
Gain on extinguishment of debt |
— |
|
|
|
— |
|
|
|
(0.03 |
) |
|
|
— |
|
|
||||
Loss from equity method investment |
— |
|
|
|
— |
|
|
|
— |
|
|
|
0.05 |
|
|
||||
Gain on sale of properties |
(0.11 |
) |
|
|
— |
|
|
|
(0.16 |
) |
|
|
— |
|
|
||||
Total adjustments to GAAP income from continuing operations before income taxes |
0.03 |
|
|
|
(0.06 |
) |
|
|
0.45 |
|
|
|
(0.09 |
) |
|
||||
Adjustment to GAAP provision for income taxes |
0.01 |
|
|
|
0.09 |
|
|
|
(0.16 |
) |
|
|
0.09 |
|
|
||||
Total adjustment to continuing operations, net of taxes |
0.04 |
|
|
|
0.03 |
|
|
|
0.28 |
|
|
|
(0.00 |
) |
|
||||
Discontinued operations |
0.02 |
|
|
|
(0.13 |
) |
|
|
0.24 |
|
|
|
(5.15 |
) |
|
||||
Incremental dilution effect |
— |
|
|
|
— |
|
|
|
— |
|
|
|
— |
|
|
||||
Diluted net income per share (Non-GAAP) |
$ |
0.40 |
|
|
|
$ |
0.26 |
|
|
|
$ |
1.44 |
|
|
|
$ |
0.90 |
|
|
|
|
|
|
|
|
|
|
||||||||||||
Diluted weighted-average shares outstanding |
587 |
|
|
|
639 |
|
|
|
600 |
|
|
|
643 |
|
|
||||
Incremental dilution |
— |
|
|
|
— |
|
|
|
— |
|
|
|
— |
|
|
||||
Diluted weighted-average shares outstanding (Non-GAAP) |
587 |
|
|
|
639 |
|
|
|
600 |
|
|
|
643 |
|
|
||||
| __________________ | ||
(1) |
This presentation includes non-GAAP measures. Non-GAAP financial measures are supplemental and should not be considered a substitute for financial information presented in accordance with GAAP. For a detailed explanation of these non-GAAP measures, see Appendix A. |
|
(2) |
Amounts may not add due to rounding. |
|
NORTONLIFELOCK INC. |
|||||||||||||||||||||||||
Consumer Revenues, Consumer Reported Billings and Consumer Cyber Safety Metrics |
|||||||||||||||||||||||||
(In millions, except per user data, unaudited) |
|||||||||||||||||||||||||
Consumer Revenues (Non-GAAP) |
|
|
|
|
|
|
|
|
|
|
|
||||||||||||||
|
Three Months Ended |
|
Year Ended |
||||||||||||||||||||||
|
April 2,
|
|
April 3,
|
|
Variance in
|
|
April 2,
|
|
April 3,
|
|
Variance in
|
||||||||||||||
Revenues (1) |
$ |
672 |
|
|
|
$ |
614 |
|
|
|
9 |
% |
|
$ |
2,551 |
|
|
|
$ |
2,490 |
|
|
|
2 |
% |
Contract liabilities fair value adjustment (2) |
5 |
|
|
|
— |
|
|
|
|
|
5 |
|
|
|
— |
|
|
|
|
||||||
Exclude revenues from ID Analytics (3) |
— |
|
|
|
(4 |
) |
|
|
|
|
— |
|
|
|
(46 |
) |
|
|
|
||||||
Consumer revenues (Non-GAAP) |
677 |
|
|
|
610 |
|
|
|
11 |
% |
|
2,556 |
|
|
|
2,444 |
|
|
|
5 |
% |
||||
Exclude foreign exchange impact (4) |
(14 |
) |
|
|
— |
|
|
|
|
|
(28 |
) |
|
|
— |
|
|
|
|
||||||
Constant currency adjusted consumer revenues (Non-GAAP) |
663 |
|
|
|
610 |
|
|
|
9 |
% |
|
2,528 |
|
|
|
2,444 |
|
|
|
3 |
% |
||||
Exclude extra week impact (1) |
— |
|
|
|
— |
|
|
|
|
|
— |
|
|
|
(44 |
) |
|
|
|
||||||
Constant currency and extra week adjusted consumer revenues (Non-GAAP) |
$ |
663 |
|
|
|
$ |
610 |
|
|
|
9 |
% |
|
$ |
2,528 |
|
|
|
$ |
2,400 |
|
|
|
5 |
% |
| Consumer Reported Billings (Non-GAAP) |
|
|
|
|
|
|
|
||||||||||||||||||
|
Three Months Ended |
|
Year Ended |
||||||||||||||||||||||
|
April 2,
|
|
April 3,
|
|
Variance in
|
|
April 2,
|
|
April 3,
|
|
Variance in
|
||||||||||||||
Revenues (1) |
$ |
672 |
|
|
|
$ |
614 |
|
|
|
9 |
% |
|
$ |
2,551 |
|
|
|
$ |
2,490 |
|
|
|
2 |
% |
Add: Contract liabilities (end of period) |
1,265 |
|
|
|
1,076 |
|
|
|
|
|
1,265 |
|
|
|
1,076 |
|
|
|
|
||||||
Less: Contract liabilities (beginning of period) |
(1,135 |
) |
|
|
(1,047 |
) |
|
|
|
|
(1,076 |
) |
|
|
(1,059 |
) |
|
|
|
||||||
Add: Other contract liabilities adjustment (5) |
(54 |
) |
|
|
— |
|
|
|
|
|
(54 |
) |
|
|
5 |
|
|
|
|
||||||
Reported billings (Non-GAAP) |
748 |
|
|
|
643 |
|
|
|
16 |
% |
|
2,686 |
|
|
|
2,512 |
|
|
|
7 |
% |
||||
Exclude revenue from ID Analytics (3) |
— |
|
|
|
(4 |
) |
|
|
|
|
— |
|
|
|
(46 |
) |
|
|
|
||||||
Consumer reported billings (Non-GAAP) |
748 |
|
|
|
639 |
|
|
|
17 |
% |
|
2,686 |
|
|
|
2,466 |
|
|
|
9 |
% |
||||
Exclude extra week impact (1) |
— |
|
|
|
— |
|
|
|
|
|
— |
|
|
|
(44 |
) |
|
|
|
||||||
Consumer reported billings excluding extra week impact (Non-GAAP) |
$ |
748 |
|
|
|
$ |
639 |
|
|
|
17 |
% |
|
$ |
2,686 |
|
|
|
$ |
2,422 |
|
|
|
11 |
% |
| Consumer Cyber Safety Metrics | |||||||||||||||||||
|
Three Months Ended |
|
Year Ended |
||||||||||||||||
|
April 2,
|
|
January 1,
|
|
April 3,
|
|
April 2,
|
|
April 3,
|
||||||||||
Direct customer revenues |
$ |
602 |
|
|
$ |
569 |
|
|
$ |
549 |
|
|
$ |
2,286 |
|
|
$ |
2,204 |
|
Partner revenues |
$ |
75 |
|
|
$ |
70 |
|
|
$ |
61 |
|
|
$ |
270 |
|
|
$ |
240 |
|
Revenues from ID Analytics |
$ |
— |
|
|
$ |
— |
|
|
$ |
4 |
|
|
$ |
— |
|
|
$ |
46 |
|
Average direct customer count (6) |
22.8 |
|
|
20.8 |
|
|
20.2 |
|
|
21.2 |
|
|
20.2 |
|
|||||
Direct customer count (at quarter end) |
23.0 |
|
|
21.0 |
|
|
20.2 |
|
|
23.0 |
|
|
20.2 |
|
|||||
Direct average revenue per user (ARPU) (7) |
$ |
8.80 |
|
|
$ |
9.10 |
|
|
$ |
9.07 |
|
|
$ |
9.01 |
|
|
$ |
8.90 |
|
Consumer Cyber Safety annual retention rate |
|
|
|
|
|
|
85 |
% |
|
85 |
% |
||||||||
| __________________ | ||
(1) |
The year ended April 2, 2021 consisted of 52 weeks, whereas the year ended April 3, 2020 consisted of 53 weeks. The impact of the extra week on revenues in the year ended April 3, 2020 is estimated to be approximately $44 million. |
|
(2) |
Contract liabilities fair value adjustment represents the deferred revenue haircut recognized due to the acquisition of Avira during the fourth quarter of fiscal 2021. |
|
(3) |
In the three months ended April 3, 2020, we divested our ID Analytics solutions and are presenting consumer reported billings and consumer revenues to enhance comparability of the reported billings and revenues of our remaining solutions to the year ago period. |
|
(4) |
Calculated using year ago foreign exchange rates. |
|
(5) |
Other contract liabilities adjustment for the year ended April 3, 2020 represents the change in contract liabilities related to Veritas discontinued operations of $5 million. Other contract liabilities adjustment for the three months and year ended April 2, 2021 represents the acquired $54 million of contract liabilities from Avira. We present an adjusted consumer reported billings to enhance comparability of the reported billings of our remaining solutions to the year ago period. |
|
(6) |
Average direct customer count calculation for the three months ended April 2, 2021 was pro-rated to include 1.6 million customers from the Avira acquisition. Average direct customer count for the year ended April 2, 2021 is calculated as an average of the fiscal quarters. |
|
(7) |
ARPU in the year ended April 3, 2020 was normalized to exclude the impact of the extra week on direct revenue, which we estimate to be approximately $41 million. |
|
|
||
NORTONLIFELOCK INC.
Appendix A
Explanation of Non-GAAP Measures and Other Items
Objective of non-GAAP measures: We believe our presentation of non-GAAP financial measures, when taken together with corresponding GAAP financial measures, provides meaningful supplemental information regarding the Company’s operating performance for the reasons discussed below. Our management team uses these non-GAAP financial measures in assessing NortonLifeLock’s performance, as well as in planning and forecasting future periods. Due to the importance of these measures in managing the business, we use non-GAAP measures in the evaluation of management’s compensation. These non-GAAP financial measures are not computed according to GAAP and the methods we use to compute them may differ from the methods used by other companies. Non-GAAP financial measures are supplemental and should not be considered a substitute for financial information presented in accordance with GAAP and should be read only in conjunction with our consolidated financial statements prepared in accordance with GAAP.
Contract liabilities adjustment: Our non-GAAP net revenues eliminate the impact of contract liabilities purchase accounting adjustments required by GAAP. GAAP requires an adjustment to the liability for acquired contract liabilities such that the liability approximates how much we, the acquirer, would have to pay a third party to assume the liability. We believe that eliminating the impact of this adjustment improves the comparability of revenues between periods. Also, although the adjustment amounts will never be recognized in our GAAP financial statements, we do not expect the acquisitions to affect the future renewal rates of revenues excluded by the adjustments. In addition, our management uses non-GAAP net revenues, adjusted for the impact of purchase accounting adjustments to assess our operating performance and overall revenue trends. Nevertheless, non-GAAP net revenues has limitations as an analytical tool and should not be considered in isolation or as a substitute for GAAP net revenues. We believe these adjustments are useful to investors as an additional means to reflect revenue trends of our business. However, other companies in our industry may not calculate these measures in the same manner which may limit their usefulness for comparative purposes.
Stock-based compensation: This consists of expenses for employee restricted stock units, performance-based awards, bonus share programs, stock options and our employee stock purchase plan, determined in accordance with GAAP. We evaluate our performance both with and without these measures because stock-based compensation is a non-cash expense and can vary significantly over time based on the timing, size, nature and design of the awards granted, and is influenced in part by certain factors that are generally beyond our control, such as the volatility of the market value of our common stock. In addition, for comparability purposes, we believe it is useful to provide a non-GAAP financial measure that excludes stock-based compensation to facilitate the comparison of our results to those of other companies in our industry.
Amortization of intangible assets: Amortization of intangible assets consists of amortization of acquisition-related intangibles assets such as developed technology, customer relationships and trade names acquired in connection with business combinations. We record charges relating to the amortization of these intangibles within both cost of revenues and operating expenses in our GAAP financial statements. Under purchase accounting, we are required to allocate a portion of the purchase price to intangible assets acquired and amortize this amount over the estimated useful lives of the acquired intangible assets. However, the purchase price allocated to these assets is not necessarily reflective of the cost we would incur to internally develop the intangible asset. Further, amortization charges for our acquired intangible assets are inconsistent in size and are significantly impacted by the timing and valuation of our acquisitions. We eliminate these charges from our non-GAAP operating results to facilitate an evaluation of our current operating performance and provide better comparability to our past operating performance.
Restructuring and other costs: Restructuring charges are costs associated with a formal restructuring plan and are primarily related to employee severance and benefit arrangements, contract termination costs, and assets write-offs, as well as other exit and disposal costs. Included in other exit and disposal costs are advisory fees incurred in connection with restructuring events and facilities exit costs. Separation costs primarily consist of consulting costs incurred in connection with the divestiture of our Enterprise Security business (the Broadcom sale). We exclude restructuring and other costs from our non-GAAP results as we believe that these costs are incremental to core activities that arise in the ordinary course of our business and do not reflect our current operating performance, and that excluding these charges facilitates a more meaningful evaluation of our current operating performance and comparisons to our past operating performance.
Acquisition-related costs: These represent the transaction and business integration costs related to significant acquisitions that are charged to operating expense in our GAAP financial statements. These costs include incremental expenses incurred to affect these business combinations such as advisory, legal, accounting, valuation, and other professional or consulting fees. We exclude these costs from our non-GAAP results as they have no direct correlation to the operation of our business, and because we believe that the non-GAAP financial measures excluding these costs provide meaningful supplemental information regarding the spending trends of our business. In addition, these costs vary, depending on the size and complexity of the acquisitions, and are not indicative of costs of future acquisitions.
Litigation settlement: We may periodically incur charges or benefits related to litigation settlements. We exclude these charges and benefits when associated with a significant settlement because we do not believe they are reflective of ongoing business and operating results.
Non-cash interest expense and amortization of debt issuance costs: In accordance with GAAP, we separately account for the value of the conversion feature on our convertible notes as a debt discount that reflects our assumed non-convertible debt borrowing rates. We amortize the discount and debt issuance costs over the term of the related debt. We exclude the difference between the imputed interest expense, which includes the amortization of the conversion feature and of the issuance costs, and the coupon interest payments because we believe that excluding these costs provides meaningful supplemental information regarding the cash cost of our convertible debt and enhance investors’ ability to view the Company’s results from management’s perspective.
Gains on divestiture and sale of equity method investment: We periodically recognize gains on divestitures. In the third quarter of fiscal 2020, we recognized a gain of $379 million related to the sale of our DigiCert equity interest. In the fourth quarter of fiscal 2020, we recognized a gain of $250 million related to the divestiture of our ID Analytics solutions. We have excluded these gains for purposes of calculating our non-GAAP results. We believe making these adjustments facilitates a better evaluation of our current operating performance and comparisons to past operating results.
Gain (loss) on extinguishment of debt: We record gains or losses on extinguishment of debt. Gains or losses represent the difference between the fair value of the exchange consideration and the carrying value of the liability component of the debt at the date of extinguishment. We exclude the gain or loss on debt extinguishment in our non-GAAP results because they are not reflective of our ongoing business.
Gain (loss) from equity method investment: We record gains or losses in equity method investments representing net income or loss attributable to our noncontrolling interest in companies over which we have limited control and visibility. We exclude such gains and losses in full because we lack control over the operations of the investee and the related gains and losses are not indicative of our ongoing core results.
Gain (loss) on equity investments: We record gains or losses, unrealized and realized, on equity investments in privately-held companies. We exclude the net gains or losses because we do not believe they are reflective of our ongoing business.
Gain (loss) on sale of properties: We periodically recognize gains or losses from the disposition of land and buildings. We exclude such gains or losses because they are not reflective of our ongoing business and operating results.
Income tax effects and adjustments: We use a non-GAAP tax rate that excludes (1) the discrete impacts of changes in tax legislation, (2) most other significant discrete items, (3) unrealized gains or losses from remeasurement of a foreign currency denominated deferred tax asset with no cash tax impact and (4) the income tax effects of the non-GAAP adjustment to our operating results described above. We believe making these adjustments facilitates a better evaluation of our current operating performance and comparisons to past operating results. Our tax rate is subject to change for a variety of reasons, such as significant changes in the geographic earnings mix due to acquisition and divestiture activities or fundamental tax law changes in major jurisdictions where we operate. In June 2019, the U.S. Court of Appeals for the Ninth Circuit Court issued an opinion in Altera Corp. v. Commissioner which reversed a United States Tax Court decision regarding the treatment of share-based compensation expense in a cost sharing arrangement. As a result, we recorded a cumulative income tax expense of $23 million for continuing operation in fiscal 2020, which has been excluded from our non-GAAP tax provision.
Discontinued operations: On November 4, 2019, we completed the Broadcom sale. The results of our divested operations that were subject to these divestitures are presented as discontinued operations in our statements of operations and thus have been excluded from non-GAAP net income for all reported periods.
Diluted GAAP and non-GAAP weighted-average shares outstanding: Diluted GAAP and non-GAAP weighted-average shares outstanding are the same, except in periods that there is a GAAP loss from continuing operations. In accordance with GAAP, we do not present dilution for GAAP in periods in which there is a loss from continuing operations. However, if there is non-GAAP net income, we present dilution for non-GAAP weighted-average shares outstanding in an amount equal to the dilution that would have been presented had there been GAAP income from continuing operations for the period.
Reported billings: We define reported billings as total revenue plus the change in adjusted contract liabilities. The change in contract liabilities excludes the change related to discontinued operations that does not amortize to revenue from continuing operations. We consider reported billings to be a useful metric for management and investors because it facilitates an analysis of changes in contract liabilities balances that are an indicator of the health and visibility of our business. There are several limitations related to the use of reported billings versus revenue calculated in accordance with GAAP. First, reported billings include amounts that have not yet been recognized as revenue. Second, our calculation of reported billings may be different from other companies in our industry, some of which may not use reported billings, may calculate reported billings differently, may have different reported billing frequencies, or may use other financial measures to evaluate their performance, all of which could reduce the usefulness of reported billings as a comparative measure. We compensate for these limitations by providing specific information regarding GAAP revenue and evaluating reported billings together with revenue calculated in accordance with GAAP.
Consumer reported billings: We define consumer reported billings as total revenue plus the change in adjusted contract liabilities excluding amounts related to our ID Analytics solutions. ID Analytics solutions were divested in the fourth quarter of fiscal 2020. We are presenting consumer reported billings to provide readers with a better understanding of the impact from the divestiture of ID Analytics solutions on the historical performance of our consumer business and to assist readers in analyzing our performance in future periods. This metric is subject to the same limitations as reported billings discussed above.
Bookings: Bookings are defined as customer orders received that are expected to generate net revenues in the future. We present the operational metric of bookings because it reflects customers' demand for our products and services and to assist readers in analyzing our performance in future periods.
Free cash flow: Free cash flow is defined as cash flows from operating activities less purchases of property and equipment. Free cash flow is not a measure of financial condition under GAAP and does not reflect our future contractual commitments and the total increase or decrease of our cash balance for a given period, and thus should not be considered as an alternative to cash flows from operating activities or as a measure of liquidity.
Non-GAAP constant currency adjusted revenues: Non-GAAP constant currency adjusted revenues are defined as revenues adjusted for the fair value of acquired contract liabilities and foreign exchange impact, calculated by translating current period revenue using the year ago currency conversion rate.
Consumer revenues: Consumer revenues exclude revenues from our ID Analytics solutions, which was divested in the fourth quarter of fiscal 2020. We are presenting consumer revenues to provide readers with a better understanding of the impact from the divestiture of ID Analytics solutions on our historical results and to assist readers in analyzing results in future periods.
Consumer Cyber Safety direct customer count: Direct customers are defined as active paid users of our consumer solutions who have a direct billing relationship with us at the end of the reported period. Users with multiple products or entitlements are counted for based on which solutions they are subscribed. We exclude users on free trials and promotions and users who have indirectly purchased our product or services through partners unless such users convert or renew their subscription directly with us. Average direct customer count presents the average of the total number of direct customers at the beginning and end of the fiscal quarter. Full year average direct customer count is calculated as an average across the quarters.
Consumer Cyber Safety direct average revenues per user (ARPU): ARPU is calculated as estimated direct customer revenues for the period divided by the average direct customer count for the same period, expressed as a monthly figure. We monitor ARPU because it helps us understand the rate at which we are monetizing our consumer customer base.
Annual retention rate: Annual retention rate is defined as the number of direct customers who have more than a one-year tenure as of the end of the most recently completed fiscal period divided by the total number of direct customers as of the end of the period from one year ago. We monitor annual retention rate to evaluate the effectiveness of our strategies to improve renewals of subscriptions.
