Finout Launches FinOps Dashboards to Transform Cloud Costs into Business Value
Finout Launches FinOps Dashboards to Transform Cloud Costs into Business Value
Finout’s new suite of business intelligence dashboards provide teams with actionable business insights alongside traditional SRE dashboarding data
NEW YORK--(BUSINESS WIRE)--Finout, the modern cloud cost management tool, today launched FinOps Dashboards that abstract the cost of technical resources to business metrics and KPIs that the CFO and broader finance team cares about. Instead of having to justify cloud spend by looking at the raw data of how much each Amazon EC2 instance costs, for example, DevOps and Finance teams alike can slice and dice the data in terms of cost per transaction or cost per customer.
“More and more developers and SREs are responsible for tracking and reporting the costs of everything supporting their applications – from the underlying cloud costs to the observability tools monitoring the health of the service,” said Roi Ravhon, CEO and Co-Founder of Finout. “But these are very technical terms and concepts that make it difficult to communicate effectively with finance. We are giving DevOps teams the ability to translate these technical costs into collaborative visualizations with our new FinOps Dashboards, which can sit right next to traditional SRE dashboards like you’d see in Datadog, for a more complete view of the story that gets everyone on the same page.”
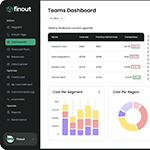
These new visualizations from Finout will provide a wide range of users with the ability to create and customize the view they need to fully monitor, manage, and understand cloud spend. The CFO can have a screen to track the spend on every feature in the product, while the VP of Engineering can see how much every team has cost him.
“Finout is now being used daily to track usage and gross margin for better visibility to the leadership team and to measure unit cost over time and allocate it to our customers,” said Yulia Perlis, Cloud FinOps Team Lead at Logz.io.
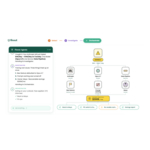
Each widget can have its own visualization type, advanced filters, and group-bys. Widgets can even have their own metric assigned to them, to create on-the-fly unit-economics visualizations to quickly understand business metrics like “cost per transaction” or “cost per CPU”. Each dashboard can then be scheduled as a report creating the most comprehensive FinOps reporting mechanism in the industry.
Every line item within the centralized bill can be attributed to its business role, feature, team and product using advanced assignment rules and virtual tagging. The FinOps dashboards can also correlate cloud costs to unit economics using external metrics and business data sources such as Datadog, Salesforce, Looker and more and even add revenue data to show profitability margins for each customer.
Finout emerged out of stealth in June with $18.5 Million in funding from Team8 Capital, Pitango First, R Squared Ventures, Jibe Ventures, Ariel Maislos and industry-leading angel investors. The platform is already being used in production within companies such as Logz.io, Riskified, and WalkMe. Finout combines all invoices across various cloud providers and services such as AWS, Datadog, Kubernetes, Snowflake and GCP into one centralized bill, enabling an unparalleled view of cloud spend in seconds.
About Finout
Finout is a modern, self-service cloud cost management and observability tool that provides FinOps unmatched business context into cloud environments. By correlating business metrics with cloud costs, Finout clients are empowered to make healthier business decisions that improve efficiency, pricing and go-to-market strategy. For more information, please visit: www.finout.io
Contacts
Adam LaGreca
adam@10kmedia.co