SoFi Technologies, Inc. Reports First Quarter 2022 Results
SoFi Technologies, Inc. Reports First Quarter 2022 Results
Record GAAP and Adjusted Net Revenue for First Quarter 2022
GAAP Net Revenue of $330 Million Up 69%; $322 Million Record Adjusted Net Revenue Up 49% Year-over-Year
Adjusted EBITDA of $9 Million Positive for Seventh Straight Quarter
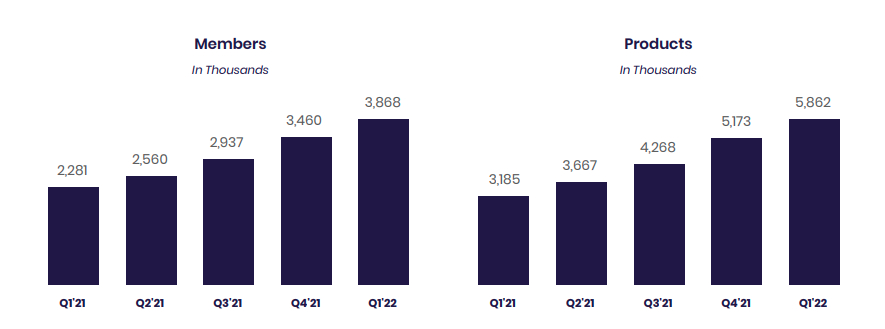
New Member Adds of 408,000; Quarter-End Total Members Up 70% Year-over-Year to Nearly 3.9 Million
New Product Adds of 689,000; Quarter-End Total Products Up 84% Year-over-Year to Nearly 5.9 Million
Management Raises Full-Year 2022 Guidance
SAN FRANCISCO--(BUSINESS WIRE)--SoFi Technologies, Inc. (NASDAQ: SOFI), a member-centric, one-stop shop for digital financial services that helps members borrow, save, spend, invest and protect their money, reported financial results today for its first quarter ended March 31, 2022.
“We delivered another quarter of great results, with record adjusted net revenue up 49% year-over-year, a seventh consecutive quarter of positive adjusted EBITDA and continued robust growth in members, products and cross-buy. These strong results, which we achieved despite volatile markets and the changing political, fiscal and economic landscape, demonstrate how our strategy of building a full suite of differentiated products and services has created a uniquely diversified business that can not only endure, but outperform across market cycles,” said Anthony Noto, CEO of SoFi Technologies, Inc. “Because of the depth and breadth of our offerings, we were able to make swift and critical adjustments in priorities and spend as conditions evolved quickly, to capitalize on growth opportunities and exceed our performance targets. Strength across all three of our business segments — Lending, Technology Platform and Financial Services — drove our record first quarter adjusted net revenue of $322 million, and adjusted EBITDA of nearly $9 million.”
Consolidated Results Summary
|
|
Three Months Ended March 31, |
|
% Change |
|||||||
($ in thousands) |
|
|
2022 |
|
|
|
2021 |
|
|
||
Consolidated – GAAP |
|
|
|
|
|
|
|||||
Total net revenue |
|
$ |
330,344 |
|
|
$ |
195,984 |
|
|
69 |
% |
Net loss |
|
|
(110,357 |
) |
|
|
(177,564 |
) |
|
n/m |
|
Loss per share – basic and diluted |
|
$ |
(0.14 |
) |
|
$ |
(1.61 |
) |
|
n/m |
|
|
|
|
|
|
|
|
|||||
Consolidated – Non-GAAP |
|
|
|
|
|
|
|||||
Adjusted net revenue(1) |
|
$ |
321,727 |
|
|
$ |
216,044 |
|
|
49 |
% |
Adjusted EBITDA(1) |
|
|
8,684 |
|
|
|
4,132 |
|
|
110 |
% |
| ____________________________ | |
(1) |
Adjusted net revenue and adjusted EBITDA are non-GAAP financial measures. For more information and reconciliations to the most comparable GAAP measures, see “Non-GAAP Financial Measures” and Table 2 to the “Financial Tables” herein. |
Noto continued: “We also maintained our strong momentum in member, product and cross-buy growth, reflecting the benefits of our broad product suite and unique Financial Services Productivity Loop (FSPL) strategy. We added more than 408,000 new members, our third-highest member growth quarter, ending with nearly 3.9 million total members, up 70% year-over-year. And we added nearly 689,000 new products, our second-highest product growth quarter, ending with nearly 5.9 million total products, an 84% annual increase.”
Noto concluded: “We are also off to a great start standing up the bank: deposits totaled $1.2 billion at quarter-end and have accelerated since we raised the maximum APY to 1.25% in April. We are pleased as well with the progress we’ve made since our acquisition of Technisys, a multi-product, digital native core technology provider, in early March. Client response to the combined Galileo and Technisys value proposition has been quite positive so far, and we’re excited to leverage this new partnership to execute on our goal of building the AWS of fintech.”
Consolidated Results
Total GAAP net revenue of $330.3 million in the first quarter of 2022 increased 69% from the corresponding prior-year period total of $196.0 million. First quarter adjusted net revenue of $321.7 million was up 49% from the same prior-year period total of $216.0 million. Strength in all three of SoFi's business segments — Lending, Technology Platform and Financial Services — drove the robust year-over-year growth in these measures.
SoFi recorded a GAAP net loss of $110.4 million for the first quarter of 2022, a significant improvement from the prior-year period's net loss of $177.6 million. First quarter adjusted EBITDA of $8.7 million was positive for the seventh consecutive quarter, and increased 89% sequentially.
Member and Product Growth
SoFi achieved its third-highest member growth and second-highest product growth ever in the first quarter of 2022. New member additions of 408,036 brought total members to 3.9 million by quarter-end, up nearly 1.6 million, or 70%, from the end of 2021's first quarter.
New product additions of 688,940 in the first quarter were SoFi's second highest quarterly result. Total products of nearly 5.9 million at quarter-end were up 86% from 3.2 million at the same prior year quarter-end. Cross-bought products increased 22% year over year, as members continue to demonstrate high product satisfaction and a greater willingness to adopt new offerings across the platform, further reinforcing the value of SoFi’s unique FSPL strategy.
(1) |
Beginning in the fourth quarter of 2021, the Company included SoFi accounts on the Galileo platform-as-a-service in its total Technology Platform accounts metric to better align with the presentation of Technology Platform segment revenue. Quarterly amounts for the earlier quarters in 2021 were determined to be immaterial, and as such were not recast. |
In the Financial Services segment, total products increased by 111% year-over-year, to 4.7 million from 2.2 million. SoFi Money products (inclusive of SoFi Money cash management accounts and SoFi Checking and Savings accounts) which nearly doubled year-over-year, were once again the largest driver of new additions, followed by SoFi Invest and Relay products, which more than doubled during the period.
Lending products rose 20% year over year, up from the fourth quarter’s 18% annual growth, which represented the fourth straight quarter of accelerating year-over-year growth, driven primarily by continued record demand for personal loans.
Technology Platform enabled accounts increased by 58% year over year to 109.7 million, due to both diverse new client additions and growth among existing clients.
Lending Segment Results
Lending segment GAAP and adjusted net revenues were $253.0 million and $244.4 million, respectively, for the first quarter of 2022, up 71% and 45%, respectively. Higher loan balances and yields drove strong growth in net interest income across both personal and student loans, and record personal loan originations and strong execution drove growth in noninterest income.
Lending segment first quarter contribution profit of $133 million increased 51% from $87.7 million in the same prior-year period. Contribution margin of Lending adjusted net revenue increased to 54% from 52% in the same prior-year period. These advances reflect SoFi’s ability to capitalize on continued strong demand for its Lending products, while improving upon the member experience and realizing new efficiencies, at the same high credit underwriting standards.
Lending – Segment Results of Operations |
|
|
|
|
|
|
|||||
|
|
Three Months Ended March 31, |
|
|
|||||||
($ in thousands) |
|
|
2022 |
|
|
|
2021 |
|
|
% Change |
|
Total net revenue – Lending |
|
$ |
252,989 |
|
|
$ |
147,977 |
|
|
71 |
% |
Servicing rights – change in valuation inputs or assumptions |
|
|
(11,580 |
) |
|
|
12,109 |
|
|
(196 |
) % |
Residual interests classified as debt – change in valuation inputs or assumptions |
|
|
2,963 |
|
|
|
7,951 |
|
|
(63 |
) % |
Directly attributable expenses |
|
|
(111,721 |
) |
|
|
(80,351 |
) |
|
39 |
% |
Contribution Profit |
|
$ |
132,651 |
|
|
$ |
87,686 |
|
|
51 |
% |
|
|
|
|
|
|
|
|||||
Adjusted net revenue – Lending(1) |
|
$ |
244,372 |
|
|
$ |
168,037 |
|
|
45 |
% |
| __________________________ | |
(1) |
Adjusted net revenue – Lending represents a non-GAAP financial measure. For more information and a reconciliation to the most comparable GAAP measure, see “Non-GAAP Financial Measures” and Table 2 to the “Financial Tables” herein. |
First quarter Lending segment total origination volume increased 30% year-over-year, driven by continued strong demand for personal loans.
Record personal loan originations of more than $2 billion in the first quarter of 2022 were up $1.2 billion, or 151%, year-over-year, and were more than double pre-pandemic 2019 quarterly averages. This outperformance resulted from years of investment in technology to automate and accelerate the application to approval process for qualified borrowers and constant testing of risk controls and underwriting models to maintain the highest credit quality.
First quarter student loan volume of nearly $984 million was essentially flat with the prior-year period, but declined significantly from nearly $1.5 billion in the fourth quarter of 2021, when demand accelerated ahead of the expected January 2022 expiration of the federal student loan payment moratorium and a series of anticipated rate increases. The additional extensions announced in December 2021 and April 2022, together with growing rhetoric suggesting that President Biden may soon introduce some form of student loan forgiveness, have taken SoFi's student loan originations back below 50% of pre-Covid levels. As a reminder, SoFi issued a press release following the most recent extension in April announcing Management's expectation that a number of factors, including the impending fall midterm elections, are likely to precipitate a seventh extension beyond August 2022, and therefore the company’s adjusted full year financial guidance assumes that the student loan moratorium will not in fact end during the course of 2022.
Lending – Originations and Average Balances |
|
|
|
|
|||||
|
|
Three Months Ended March 31, |
|
% Change |
|||||
|
|
|
2022 |
|
|
2021 |
|
||
Origination volume ($ in thousands, during period) |
|
|
|
|
|
|
|||
Home loans |
|
$ |
312,383 |
|
$ |
735,604 |
|
(58 |
) % |
Personal loans |
|
|
2,026,004 |
|
|
805,689 |
|
151 |
% |
Student loans |
|
|
983,804 |
|
|
1,004,685 |
|
(2 |
) % |
Total |
|
$ |
3,322,191 |
|
$ |
2,545,978 |
|
30 |
% |
|
|
|
|
|
|
|
|||
Average loan balance ($, as of period end)(1) |
|
|
|
|
|
|
|||
Home loans |
|
$ |
284,111 |
|
$ |
285,654 |
|
(1 |
) % |
Personal loans |
|
|
23,635 |
|
|
21,515 |
|
10 |
% |
Student loans |
|
|
49,297 |
|
|
52,493 |
|
(6 |
) % |
| ____________________________ | |
| (1) | Within each loan product category, average loan balance is defined as the total unpaid principal balance of the loans divided by the number of loans that have a balance greater than zero dollars as of the reporting date. Average loan balance includes loans on the balance sheet and transferred loans with which SoFi has a continuing involvement through its servicing agreements. |
|
|
Three Months Ended March 31, |
|
|
|||
Lending – Products |
|
2022 |
|
2021 |
|
% Change |
|
Home loans |
|
24,244 |
|
15,961 |
|
52 |
% |
Personal loans |
|
657,549 |
|
517,042 |
|
27 |
% |
Student loans |
|
456,773 |
|
412,224 |
|
11 |
% |
Total lending products |
|
1,138,566 |
|
945,227 |
|
20 |
% |
Technology Platform Segment Results
Technology Platform segment net revenue of $61 million for the first quarter of 2022 increased 32% year-over-year, and includes record Galileo revenues and a small contribution from Technisys, a leading cloud-native, digital multi-product core banking platform SoFi acquired in early March. Contribution profit of just over $18 million increased 16% year over year, for a margin of 30% versus 34% for the same prior-year period. As previously stated, Management intends to continue investing heavily in the Technology Platform segment, to capture its significant and accelerating secular growth opportunities across client verticals, products and geographies. This will likely require operating this business at a 20–30% contribution margin range for the foreseeable future.
SoFi plans to leverage the combined technological capabilities of Technisys and Galileo to create the only end-to-end vertically integrated banking technology stack that can uniquely support multiple products – including checking, savings, deposits, lending, credit cards and future offerings – all surfaced through industry-leading APIs, for a broad audience that includes SoFi’s Lending and Financial Services platforms and existing Galileo and Technisys partners, along with additional established banks, fintechs and non-financial brands looking to enter financial services.
Technology Platform – Segment Results of Operations |
|||||||||||
|
|
Three Months Ended March 31, |
|
|
|||||||
($ in thousands) |
|
|
2022 |
|
|
|
2021 |
|
|
% Change |
|
Total net revenue |
|
$ |
60,805 |
|
|
$ |
46,065 |
|
|
32 |
% |
Directly attributable expenses |
|
|
(42,550 |
) |
|
|
(30,380 |
) |
|
40 |
% |
Contribution Profit |
|
$ |
18,255 |
|
|
$ |
15,685 |
|
|
16 |
% |
Technology Platform total enabled client accounts increased 58% year over year, to 109.7 million from approximately 69.6 million, through new client acquisition and growth at existing clients.
|
|
Three Months Ended March 31, |
|
|
|||
Technology Platform |
|
2022 |
|
2021 |
|
% Change |
|
Total accounts |
|
109,687,014 |
|
69,572,680 |
|
58 |
% |
Financial Services Segment Results
Net revenue of $23.5 million for the first quarter of 2022 increased 264% from the prior year period's total of $6.5 million, demonstrating SoFi’s rapid progress in monetizing this segment. The Financial Services segment contribution loss of $49.5 million was $14.0 million higher than the prior year quarter's $35.5 million loss, largely due to now having the credit card business versus just launching the business in the prior year, and needing to build current expected credit loss (CECL) reserves. These are expected to increase as the business continues to grow and scale. Management is pleased with the pace of customer acquisition and expected payback periods based on existing vintages and new member profiles across the spectrum of financial services products, though the aggregate contribution profit remains negative due to acquisition costs from the volume of new members acquired as the business scales.
Financial Services – Segment Results of Operations |
|||||||||||
|
|
Three Months Ended March 31, |
|
|
|||||||
($ in thousands) |
|
|
2022 |
|
|
|
2021 |
|
|
% Change |
|
Total net revenue |
|
$ |
23,543 |
|
|
$ |
6,463 |
|
|
264 |
% |
Directly attributable expenses |
|
|
(73,058 |
) |
|
|
(41,982 |
) |
|
74 |
% |
Contribution loss |
|
$ |
(49,515 |
) |
|
$ |
(35,519 |
) |
|
39 |
% |
By continuously innovating for members with new and relevant offerings, features and rewards, SoFi grew total Financial Services products by approximately 2.5 million, or 111%, year over year in the first quarter of 2022, bringing the total to approximately 4.7 million. SoFi Money products (inclusive of SoFi Money cash management accounts and SoFi Checking and Savings accounts) nearly doubled year over year, while every other Financial Services product SoFi has offered for at least a year (Invest, Credit Card, Relay and At Work) grew by triple digits.
Most notably, upon securing a bank charter in the first quarter of 2022, SoFi launched a new Checking and Savings offering, with an APY of 1%, no minimum balance requirement, a host of free features and a unique rewards program. In April, SoFi increased that rate to 1.25% to further improve the offering’s competitiveness and growth. SoFi is currently migrating existing SoFi Money cash management accounts to SoFi Checking and Savings, while adding significantly to new accounts and deposit balances. SoFi will hold these deposits in the SoFi Bank and use them to fund SoFi loans at a lower cost of capital, allocating the resulting savings to improving product features, selection and pricing across the entire platform. Importantly, these deposits help diversify SoFi’s sources of capital, which reduces the reliance on outside sources, including sale of loans via securitization or other markets.
Other new Financial Services offerings during the quarter include margin lending for SoFi Invest members, free cryptocurrency transactions for SoFi Invest and SoFi Money (and now SoFi Checking and Savings) members with direct deposit accounts, allowing them to automatically allocate a certain amount of each paycheck to purchasing cryptocurrency at no fee, and same-day ACH transfers for SoFi-initiated transactions, greatly simplifying the direct deposit switchover process for members.
|
|
March 31, |
|
|
|||
Financial Services – Products |
|
2022 |
|
2021 |
|
% Change |
|
SoFi Money(1) |
|
1,625,000 |
|
823,003 |
|
97 |
% |
Invest |
|
1,807,478 |
|
854,383 |
|
112 |
% |
Credit Card |
|
117,009 |
|
19,365 |
|
504 |
% |
Referred loans |
|
17,239 |
|
— |
|
n/m |
|
Relay |
|
1,115,564 |
|
523,451 |
|
113 |
% |
At Work. |
|
41,281 |
|
19,125 |
|
116 |
% |
Total financial services products |
|
4,723,571 |
|
2,239,327 |
|
111 |
% |
| ____________________________ | |
(1) |
This category includes the SoFi Money cash management accounts, as well as the SoFi Checking and Savings accounts held at SoFi Bank, which began operating in the first quarter of 2022. |
Guidance and Outlook
First quarter 2022 adjusted net revenue of $322 million exceeded quarterly guidance of $280 million to $285 million by 15% at the low end and 13% at the high end. Adjusted EBITDA of $9 million for the quarter exceeded quarterly guidance of $0 to $5 million by 74% at the high end.
Management expects a continuation of strong growth in the second quarter, with expected adjusted net revenue of $330 million to $340 million, up 39% to 43% year-over-year, and expected adjusted EBITDA of $5 million to $15 million.
Management now expects full-year 2022 adjusted net revenue of $1.505 billion to $1.510 billion and full-year adjusted EBITDA of $100 million to $105 million. Management will further address second quarter and full-year 2022 guidance on the quarterly earnings conference call.
Earnings Webcast
SoFi’s executive management team will host a live audio webcast beginning at 5:00 p.m. Eastern Time (2:00 p.m. Pacific Time) today to discuss the quarter’s financial results and business highlights. All interested parties are invited to listen to the live webcast at https://investors.sofi.com. A replay of the webcast will be available on the SoFi Investor Relations website for 30 days. Investor information, including supplemental financial information, is available on SoFi’s Investor Relations website at https://investors.sofi.com.
Cautionary Statement Regarding Forward-Looking Statements
Certain of the statements above are forward-looking and as such are not historical facts. This includes, without limitation, statements regarding our expectations for second quarter and full year adjusted net revenue and adjusted EBITDA, our expectations regarding the federal student loan payment moratorium or loan forgiveness, and the financial position, business strategy and plans and objectives of management for our future operations. These forward-looking statements are not guarantees of performance. Such statements can be identified by the fact that they do not relate strictly to historical or current facts. Words such as “anticipate”, “believe”, “continue”, “could”, “estimate”, “expect”, “intend”, “may”, "opportunity", "future", "strategy", “might”, “plan”, “possible”, “potential”, “predict”, “project”, “should”, “strive”, “suggests”, “would”, “will be”, “will continue”, “will likely result” and similar expressions may identify forward-looking statements, but the absence of these words does not mean that a statement is not forward-looking. Factors that could cause actual results to differ materially from those contemplated by these forward-looking statements include: (i) the effect of and uncertainties related to the ongoing COVID-19 pandemic (including any government responses thereto); (ii) our ability to achieve and maintain profitability and continued growth across our three businesses in the future; (iii) the impact on our business of the regulatory environment and complexities with compliance related to such environment, including any further extension of the student loan payment moratorium or loan forgiveness, and our expectations regarding the return to pre-pandemic student loan demand levels; (iv) our ability to realize the benefits of becoming a bank holding company and operating SoFi Bank; (v) our ability to respond and adapt to changing market and economic conditions, including inflationary pressures and rising interest rates; (vi) our ability to continue to drive brand awareness and realize the benefits or our integrated multi-media marketing and advertising campaigns; (vii) our ability to vertically integrate our businesses and accelerate the pace of innovation of our financial products; (viii) our ability to manage our growth effectively and our expectations regarding the development and expansion of our business; (ix) our ability to access sources of capital, including debt financing and other sources of capital to finance operations and growth; (x) the success of our continued investments in our Financial Services segment and in our business generally; (xi) the success of our marketing efforts and our ability to expand our member base; (xii) our ability to maintain our leadership position in certain categories of our business and to grow market share in existing markets or any new markets we may enter; (xiii) our ability to develop new products, features and functionality that are competitive and meet market needs; (xiv) our ability to realize the benefits of our strategy, including what we refer to as our FSPL; (xv) our ability to make accurate credit and pricing decisions or effectively forecast our loss rates; (xvi) our ability to establish and maintain an effective system of internal controls over financial reporting; (xvii) our expectations with respect to our anticipated investment levels in our Technology Platform segment and our expected margins in that segment, including our ability to realize the anticipated benefits of the Technisys acquisition; and (xviii) the outcome of any legal or governmental proceedings that may be instituted against us. The foregoing list of factors is not exhaustive. You should carefully consider the foregoing factors and the other risks and uncertainties set forth in the section titled “Risk Factors” in our last quarterly report on Form 10-Q, as filed with the Securities and Exchange Commission, and those that are included in any of our future filings with the Securities and Exchange Commission, including our annual report on Form 10-K, under the Exchange Act.
These forward-looking statements are based on information available as of the date hereof and current expectations, forecasts and assumptions, and involve a number of judgments, risks and uncertainties. Accordingly, forward-looking statements should not be relied upon as representing our views as of any subsequent date, and we do not undertake any obligation to update forward-looking statements to reflect events or circumstances after the date they were made, whether as a result of new information, future events or otherwise, except as may be required under applicable securities laws.
As a result of a number of known and unknown risks and uncertainties, our actual results or performance may be materially different from those expressed or implied by these forward-looking statements. You should not place undue reliance on these forward-looking statements.
Non-GAAP Financial Measures
This press release presents information about our adjusted net revenue and adjusted EBITDA, which are non-GAAP financial measures provided as supplements to the results provided in accordance with accounting principles generally accepted in the United States (GAAP). We use adjusted net revenue and adjusted EBITDA to evaluate our operating performance, formulate business plans, help better assess our overall liquidity position, and make strategic decisions, including those relating to operating expenses and the allocation of internal resources. Accordingly, we believe that adjusted net revenue and adjusted EBITDA provide useful information to investors and others in understanding and evaluating our operating results in the same manner as our management. These non-GAAP measures are presented for supplemental informational purposes only, have limitations as analytical tools, and should not be considered in isolation from, or as a substitute for, the analysis of other GAAP financial measures, such as total net revenue and net income (loss). Other companies may not use these non-GAAP measures or may use similar measures that are defined in a different manner. Therefore, SoFi's non-GAAP measures may not be directly comparable to similarly titled measures of other companies. Reconciliations of these non-GAAP measures to the most directly comparable GAAP financial measures are provided in Table 2 to the “Financial Tables” herein.
Forward-looking non-GAAP financial measures are presented without reconciliations of such forward-looking non-GAAP measures because the GAAP financial measures are not accessible on a forward-looking basis and reconciling information is not available without unreasonable effort due to the inherent difficulty in forecasting and quantifying certain amounts that are necessary for such reconciliations, including adjustments reflected in our reconciliation of historic non-GAAP financial measures, the amounts of which, based on historical experience, could be material.
About SoFi
SoFi's mission is to help our members achieve financial independence to realize their ambitions. Our products for borrowing, saving, spending, investing and protecting give our approximately four million members fast access to tools to get their money right. SoFi membership comes with the key essentials for getting ahead, including career advisors and connection to a thriving community of like-minded, ambitious people. SoFi is also the naming rights partner of SoFi Stadium, home of the Los Angeles Chargers and the Los Angeles Rams. For more information, visit https://www.sofi.com or download our iOS and Android apps.
Availability of Other Information About SoFi
Investors and others should note that we communicate with our investors and the public using our website (www.sofi.com), the investor relations website (https://investors.sofi.com), and on social media (Twitter and LinkedIn), including but not limited to investor presentations and investor fact sheets, Securities and Exchange Commission filings, press releases, public conference calls and webcasts. The information that SoFi posts on these channels and websites could be deemed to be material information. As a result, SoFi encourages investors, the media, and others interested in SoFi to review the information that is posted on these channels, including the investor relations website, on a regular basis. This list of channels may be updated from time to time on SoFi’s investor relations website and may include additional social media channels. The contents of SoFi’s website or these channels, or any other website that may be accessed from its website or these channels, shall not be deemed incorporated by reference in any filing under the Securities Act of 1933, as amended.
SOFI-F
Contacts
Investors:
Andrea Prochniak
SoFi Investor Relations
aprochniak@sofi.com
Media:
Rachel Rosenzweig
SoFi Media Relations
rrosenzweig@sofi.com