
")
SAN FRANCISCO--(BUSINESS WIRE)--HouseCanary, Inc. (“HouseCanary”), a leading provider of residential real estate data and home valuations, today released its latest Market Pulse report, covering 22 listing-derived metrics and comparing data between April 2020 and April 2021. The Market Pulse is an ongoing review of proprietary data and insights from HouseCanary’s nationwide platform.
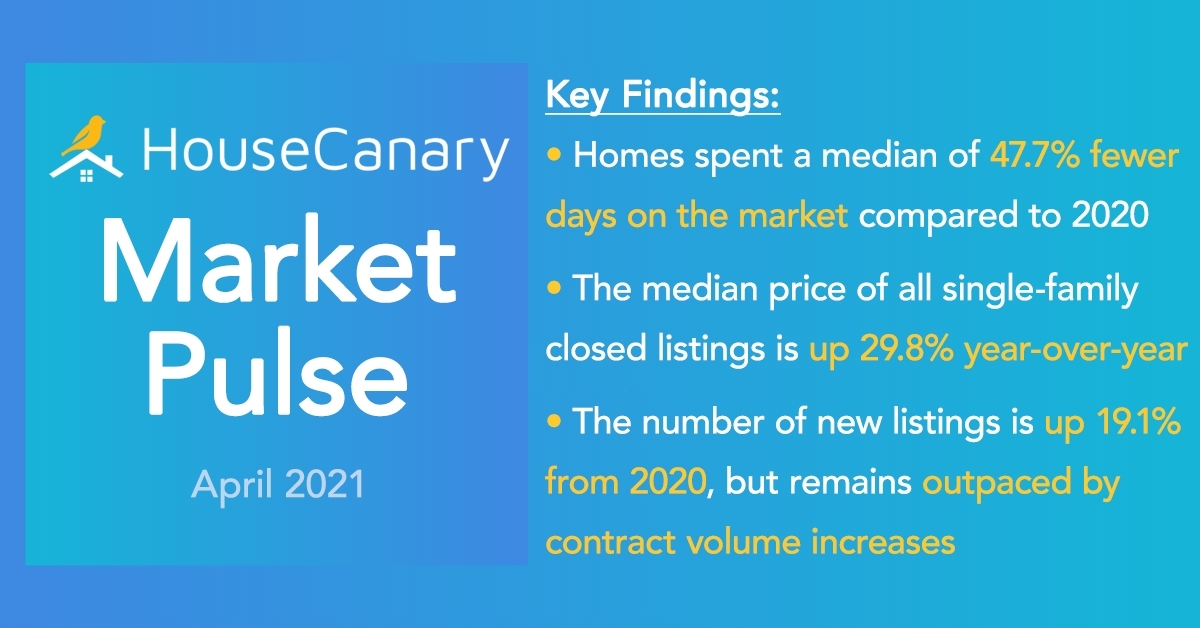
Jeremy Sicklick, Co-founder and Chief Executive Officer of HouseCanary, commented: “Last spring, the real estate market was rocked as a result of COVID-19 lockdowns, but what ensued was a housing boom marked by residential home prices hitting all-time highs, record low mortgage rates, and extremely limited inventory coupled with unwavering demand from buyers. One year later, we are finally starting to see some positive developments on the supply side for the first time since the pandemic began. New listings are up 19.1% year-over-year, however, the number of listings under contract continues to outpace the increase in new listings, which leads us to believe that the supply shortage will hold strong in the short-term.”
Select findings from this month’s Market Pulse are below. Be sure to review the Market Pulse in full for extensive state-level data.
Total Net New Listings:
- Since April 2020, there have been 3,045,485 net new listings placed on the market, which is an 8.8% increase versus the same period in 2019
-
Percentage of total net new listings over the last 52 weeks, broken down by home price:
- $0-$200k: 20.6%
- $200k-$400k: 42.9%
- $400k-$600k: 18.8%
- $600k-$1mm: 11.6%
- >$1mm: 6.1%
-
Percent change in net new listing activity over the last 52 weeks versus the same period in 2019, broken down by home price:
- $0-$200k: (-18.2%)
- $200k-$400k: +3.4%)
- $400k-$600k: +30.8%
- $600k-$1mm: +54.9%
- >$1mm: +81.4%
Monthly Net New Listing Volume (Single-Family Detached Homes):
- Monthly new listing volume was up 19.1% compared to April 2020
- In April, there were 329,633 net new listings placed on the market, representing a 36.7% increase year-over-year
-
Percent change in net new listing activity year-over-year, broken down by home price:
- $0-$200k: +5.2%
- $200k-$400k: +16.8%
- $400k-$600k: +65.0%
- $600k-$1mm: +114.8%
- >$1mm: +151.1%
Listings Under Contract:
- Over the last 52 weeks, 3,460,246 properties have gone into contract, representing a 14.1% increase relative to the same period in 2019
-
Percentage of total contract volume since April 2020, broken down by home price:
- $0-$200k: 20.9%
- $200k-$400k: 43.1%
- $400k-$600k: 18.7%
- $600k-$1mm: 11.4%
- >$1mm: 5.8%
-
Percent change in contract volume over the last 52 weeks versus the same period in 2019, broken down by home price:
- $0-$200k: (-13.3%)
- $200k-$400k: +9.6%
- $400k-$600k: +36.8%
- $600k-$1mm: +59.4%
- >$1mm: +80.6%
-
Monthly Contract Volume (Single-Family Detached Homes):
- For the month of April, there were 368,241 listings that went under contract nationwide, which is a 39.1% increase year-over-year
-
For the month of April, the percent change in contract volume compared to April 2020, broken down by home price:
- $0-$200k: (-2.1%)
- $200k-$400k: +19.7%
- $400k-$600k: +80.5%
- $600k-$1mm: +148.1%
- >$1mm: +231.3%
Median Listing Price Activity (Single-Family Detached Homes):
- For the week ending May 7, 2021, the median price of all single-family listings in the US was $384,565, a 0.5% increase month-over-month
- For the week ending May 7, 2021, the median closed price of single-family listings in the US was $382,703, up 3.4% month-over-month
- The median price of all single-family listings in the U.S. is up 17.0% year-over-year and the median price of closed listings has increased by 29.8% year-over-year
As a nationwide real estate broker, HouseCanary’s broad multiple listing service (“MLS”) participation allows us to evaluate listing data and aggregate the number of new listings as well as the number of new listings going into contract for all single-family detached homes observed in the HouseCanary database. Using this data, HouseCanary continues to track listing volume, new listings, and median list price for 41 states and 50 individual Metropolitan Statistical Areas (“MSAs”).
About HouseCanary:
Founded in 2013, valuation-focused real estate brokerage HouseCanary provides software and services to reshape the real estate marketplace. Financial institutions, investors, lenders, mortgage investors, and consumers turn to HouseCanary for industry-leading valuations, forecasts, and transaction-support tools. These clients trust HouseCanary to fuel acquisition, underwriting, portfolio management, and more. Learn more at www.housecanary.com.