Best Performing Funds from March 2020 to March 2021 by AlternativeSoft
Best Performing Funds from March 2020 to March 2021 by AlternativeSoft
LONDON--(BUSINESS WIRE)--In this article, among four equity indices, the largest mutual fund and the largest hedge fund, we search for the highest cumulative return from March 2020 to March 2021.
We use the newest technical feature of AlternativeSoft platform, “Compare Assets” to conduct this analysis.
The indices used are: S&P500, NASDAQ 100, Russell 2000 Growth, and HFRI Equity Hedge (Total) Index. We also added the Vanguard Total Stock Market Index Fund Admiral Share, and Bridgewater Pure Alpha 12% Strategy*i Hedge Fund. These are the largest Hedge Funds and Mutual Funds in terms of assets managed.
A carefully weighted Ranking of Statistics was chosen for running the analysis, specifically: 50% Annualized Return rank + 12.50% Annualized Volatility rank + 25% Normal Monthly VaR rank + 12.50% Max Drawdown rank.
Statistics Computed Between March 2020 and 2021 |
S&P 500 TR Index |
NASDAQ 100 |
Russell 2000 Growth |
HFRI Equity Hedge (Total) Index |
Vanguard Total Stock Market Index Fund Admiral Shares |
Bridgewater Pure Alpha 12% Strategy |
Weighted Rank |
6 |
3 |
1 |
2 |
5 |
4 |
Asset Info |
|
|
|
|
|
|
Asset Type |
Index |
Index |
Index |
Index |
Mutual Fund |
Hedge Fund |
Fund AUM (m) |
|
|
|
|
280,758.33 |
77,811.00 |
Return Statistics |
|
|
|
|
|
|
Annualized Return |
30.62% |
56.09% |
100.81% |
30.79% |
35.60% |
-2.64% |
Return during 2021 |
3.48 |
-4.12 |
2.59% |
6.35% |
2.85% |
-0.44% |
Return during 2020 |
29.07% |
68.96% |
107.44% |
22.98% |
31.84% |
-2.21% |
Annual Outperformance vs S&P500 Index |
0.00% |
25.47% |
70.19% |
-0.50% |
4.31% |
-33.93% |
Risk Statistics |
|
|
|
|
|
|
Annualized Volatility |
22.73% |
24.53% |
23.52% |
17.22% |
25.24% |
12.85% |
Annual Sharpe Ratio (Rf=0.25%) |
1.34 |
2.28 |
4.28 |
1.77 |
1.40 |
-0.23 |
Ann. Information Ratio vs S&P500 TR Index |
|
0.82 |
2.54 |
-0.05 |
1.95 |
-2.42 |
Annual Jensen Alpha vs S&P500 TR Index (Rf=0.25%) |
0.00% |
51.31% |
91.56% |
9.64% |
2.40% |
-17.55% |
Beta to S&P500 TR Index |
1.00 |
0.15 |
0.30 |
0.67 |
1.06 |
0.47 |
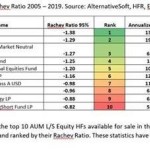
Serenity Ratio at 95% |
13.92 |
21.25 |
279.28 |
13.86 |
14.50 |
-0.48 |
Value-at-Risk |
|
|
|
|
|
|
Normal monthly VaR 99% |
-12.81% |
-12.47% |
-9.61% |
-9.19% |
-14.13% |
-8.78% |
Modified monthly VaR 99% |
-16.56% |
-12.05% |
-7.71% |
-14.91% |
-19.16% |
-13.55% |
Conditional monthly VaR 99% |
-12.35% |
-6.99% |
-5.22% |
-10.89% |
-13.77% |
-10.62% |
Extreme Risk Statistics |
|
|
|
|
|
|
Max Drawdown |
-12.35% |
-12.69% |
-5.22% |
-10.89% |
-13.77% |
-10.62% |
Max Time-under-water (months) |
2 |
7 |
2 |
3 |
2 |
12 |
Max Possible Drawdown 99.9% |
-41.95% |
-29.88% |
-17.81% |
-24.80% |
-45.01% |
-100.00% |
Max Drawdown rank.
Source: Eurekahedge, Morningstar, AlternativeSoft.
If we look only at Annualized Return Mar2020 to Mar2021, the results show that Russell 2000 Growth index clearly outperformed others with 100.81% Annualized Return and the best Max Drawdown. The runner-up is the HFRI Equity Hedge (Total) Index followed by NASDAQ 100 Index.
Bridgewater Pure Alpha 12% Strategy had negative Annualized Return however, it also had lower risk metrics, and was placed 4th.
i This is the highest AUM fund of Bridgewater Associates
N.B. This article does not constitute any professional investment advice or recommendations to buy, sell, or hold any investments or investment products of any kind, and should be treated as more of an illustrative piece for educational purposes.
To trial a truly powerful and comprehensive analytic software for investment decisions, fund allocation, and our new, innovative digital due diligence visit alternativesoft.com, call us on +44 20 7510 2003, or email us information@alternativesoft.com.
Contacts
Name: Mitesh Gohil
Phone: +44 20 7510 2003
Email: information@alternativesoft.com