Home Equity Continues to Soar: Homeowners Gained Over $1.5 Trillion in Equity in 2020, CoreLogic Reports
Home Equity Continues to Soar: Homeowners Gained Over $1.5 Trillion in Equity in 2020, CoreLogic Reports
- The number of mortgages in negative equity fell by 21% year over year in Q4 2020
- Average annual equity gain of $26,300 per homeowner in Q4 2020 was highest since Q4 2013

IRVINE, Calif.--(BUSINESS WIRE)--CoreLogic® (NYSE: CLGX), a leading global property information, analytics and data-enabled solutions provider, today released the Home Equity Report for the fourth quarter of 2020. The report shows U.S. homeowners with mortgages (which account for roughly 62% of all properties) have seen their equity increase by 16.2% year over year, representing a collective equity gain of over $1.5 trillion, and an average gain of $26,300 per homeowner, since the fourth quarter of 2019.
As competition for the dwindling supply of for-sale homes drove prices up, average annual homeowner equity gains in the fourth quarter of 2020 reached the highest level since 2013. For current owners, these gains have created a buffer against financial difficulties brought on by the pandemic, and enabled means for pursuing renovations as people are spending more time at home. For the broader market, home equity gains have also reduced the risk of homes falling underwater and pushing distressed sales into the market.
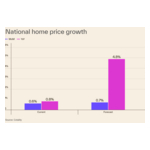
“Compared with a year earlier, home prices in December 2020 were up sharply — 9.2%, according to the CoreLogic Home Price Index — boosting the amount of home equity for the average homeowner with a mortgage to more than $200,000,” said Dr. Frank Nothaft, chief economist for CoreLogic. “This equity growth has enabled many families to finance home remodeling, such as adding an office or study, further contributing to last year’s record level in home improvement spending.”
“Positive factors like record-low interest rates and a booming housing market encouraged many families to enter homeownership,” said Frank Martell, president and CEO of CoreLogic. “This growing bank of personal wealth that homeownership affords was noticed by many but in particular for first-time buyers who want a piece of the cake. As a result, we may see more of those currently renting start to enter the market in the near future.”
Negative equity, also referred to as underwater or upside down, applies to borrowers who owe more on their mortgages than their homes are currently worth. As of the fourth quarter of 2020, negative equity share, and the quarter-over-quarter and year-over-year changes, were as follows:
- Quarterly change: From the third quarter of 2020 to the fourth quarter of 2020, the total number of mortgaged homes in negative equity decreased by 8% to 1.5 million homes or 2.8% of all mortgaged properties.
- Annual change: In the fourth quarter of 2019, 1.9 million homes, or 3.6% of all mortgaged properties, were in negative equity. This number decreased by 21%, or 410,000 properties, in the fourth quarter of 2020.
- National aggregate value: The national aggregate value of negative equity was approximately $280.2 billion at the end of the fourth quarter of 2020. This is down quarter over quarter by approximately $3.4 billion, or 1.2%, from $283.6 billion in the third quarter of 2020, and down year over year by approximately $7.5 billion, or 2.6%, from $287.7 billion in the fourth quarter of 2019.
Because home equity is affected by home price changes, borrowers with equity positions near (+/-5%) the negative equity cutoff are most likely to move out of or into negative equity as prices change, respectively. Looking at the fourth quarter of 2020 book of mortgages, if home prices increase by 5%, 216,000 homes would regain equity; if home prices decline by 5%, 292,000 would fall underwater.
State and Metro Takeaways:
- States with strong home price growth and high home prices continued to experience the largest gains in equity, whereas states that were hard hit by the pandemic continue to experience dwindling gains.
- California, Idaho and Washington experienced the largest average equity gains at $54,500, $48,500 and $47,200 respectively.
- Meanwhile, North Dakota experienced the lowest average equity gain in the fourth quarter of 2020 at $7,900.
The next CoreLogic Homeowner Equity Report will be released in June 2021, featuring data for Q1 2021. For ongoing housing trends and data, visit the CoreLogic Insights Blog: www.corelogic.com/insights-index.aspx.
Methodology
The amount of equity for each property is determined by comparing the estimated current value of the property against the mortgage debt outstanding (MDO). If the MDO is greater than the estimated value, then the property is determined to be in a negative equity position. If the estimated value is greater than the MDO, then the property is determined to be in a positive equity position. The data is first generated at the property level and aggregated to higher levels of geography. CoreLogic uses public record data as the source of the MDO, which includes more than 50 million first- and second-mortgage liens, and is adjusted for amortization and home equity utilization in order to capture the true level of MDO for each property. Only data for mortgaged residential properties that have a current estimated value are included. There are several states or jurisdictions where the public record, current value or mortgage data coverage is thin and have been excluded from the analysis. These instances account for fewer than 5% of the total U.S. population. The percentage of homeowners with a mortgage is from the 2018 American Community Survey. Data for the previous quarter was revised. Revisions with public records data are standard, and to ensure accuracy, CoreLogic incorporates the newly released public data to provide updated results.
Source: CoreLogic
The data provided is for use only by the primary recipient or the primary recipient's publication or broadcast. This data may not be re-sold, republished or licensed to any other source, including publications and sources owned by the primary recipient's parent company without prior written permission from CoreLogic. Any CoreLogic data used for publication or broadcast, in whole or in part, must be sourced as coming from CoreLogic, a data and analytics company. For use with broadcast or web content, the citation must directly accompany first reference of the data. If the data is illustrated with maps, charts, graphs or other visual elements, the CoreLogic logo must be included on screen or website. For questions, analysis or interpretation of the data, contact Valerie Sheets at newsmedia@corelogic.com. Data provided may not be modified without the prior written permission of CoreLogic. Do not use the data in any unlawful manner. This data is compiled from public records, contributory databases and proprietary analytics, and its accuracy is dependent upon these sources.
About CoreLogic
CoreLogic (NYSE: CLGX), the leading provider of property insights and solutions, promotes a healthy housing market and thriving communities. Through its enhanced property data solutions, services and technologies, CoreLogic enables real estate professionals, financial institutions, insurance carriers, government agencies and other housing market participants to help millions of people find, buy and protect their homes. For more information, please visit www.corelogic.com.
CORELOGIC and the CoreLogic logo are trademarks of CoreLogic, Inc. and/or its subsidiaries. All other trademarks are the property of their respective owners.
Contacts
Valerie Sheets
CoreLogic
newsmedia@corelogic.com