New Data from HouseCanary Shows Sustained Gap in Housing Supply and Demand Has Ignited Aggressive “Bidding Wars” for Home Buyers
New Data from HouseCanary Shows Sustained Gap in Housing Supply and Demand Has Ignited Aggressive “Bidding Wars” for Home Buyers
Tight Supply Persists with New Listing Volume Down 6.9% Week-Over-Week and Net New Listings 11.3% Below 2019 Levels
Home Sales Activity Continues to Outpace 2019 Levels by 2.1% as Pipeline of Buyers Remains Resilient due to Ultra-Low Borrowing Rates
Continued Supply-Demand Imbalance Has Created a Challenge for Buyers Searching for Lower Priced Homes, as Contract Volume for the $0-$200k Price Bin is Down 13.4% Year-Over-Year

SAN FRANCISCO--(BUSINESS WIRE)--HouseCanary, Inc. (“HouseCanary”), a leading provider of residential real estate data and home valuations, today released its latest Market Pulse report, covering 22 listing-derived metrics and comparing data between the week ending September 25, 2020 and the week ending March 13, 2020 versus the same period in 2019. The Market Pulse is an ongoing review of proprietary data and insights from HouseCanary’s nationwide platform.
Jeremy Sicklick, Co-founder and Chief Executive Officer of HouseCanary, commented: “Although homebuyer demand often eases in October, that is not going to be the case this year as the line of prospective purchasers remains very strong thanks to record-low mortgage rates and the normalization of work-from-home jobs. The pandemic and uncertainty stemming from the upcoming election have left homeowners reluctant to list their homes, exacerbating an already large gap in the market and propping up home prices across the country. This supply-demand imbalance is now producing competitive bidding wars and yielding inflated offers — in some markets — that effectively serve as a roadblock for many first-time buyers looking at lower price tiers. While we do not expect a significant shift in supply or demand in Q4, the great unknown is the potential impact that a resurgence of COVID-19 or a political change in D.C. might have on both housing and the overall economy.”
Select findings from this week’s Market Pulse are below. Be sure to review the Market Pulse in full for extensive state-level data.
Weekly Contract Volume (Single-Family Detached Homes):
- Weekly contract volume is down 5.3% week-over-week
-
Percent change in contract volume week-over-week, broken down by home price:
- $0-$200k: (-5.0%)
- $200k-$400k: (-4.3%)
- $400k-$600k: (-5.1%)
- $600k-$1mm: (-8.3%)
- >$1mm: (-9.3%)
-
The total volume of listings going into contract since the week ending March 13 versus the same period in 2019, broken down by home price:
- $0-$200k: (-13.4%)
- $200k-$400k: +2.8%
- $400k-$600k: +14.2%
- $600k-$1mm: +18.7%
- >$1mm: +19.7%
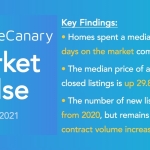
Total Net New Listings:
- Since the week ending March 13, there have been 1,698,108 net new listings placed on the market, representing a 11.3% decrease relative to the same period in 2019
- For the week ending September 25, there were 49,943 net new listings placed on the market, representing a 10.3% decrease compared to the previous week
-
Percentage of total net new listings since March 13, broken down by home price:
- $0-$200k: 22.2%
- $200k-$400k: 44.5%
- $400k-$600k: 17.8%
- $600k-$1mm: 10.3%
- >$1mm: 5.2%
Weekly New Listing Volume (Single-Family Detached Homes):
- New listing volume is down 6.9% week-over-week
-
Percent change in new listing activity since the week ending March 13 versus the same period in 2019, broken down by home price:
- $0-$200k: (-29.2%)
- $200k-$400k: (-13.4%)
- $400k-$600k: (-4.7%)
- $600k-$1mm: +0.3%
- >$1mm: +3.7%
Total Listings Under Contract:
- Since the week ending March 13, 1,922,248 properties have gone into contract across 41 states, representing a 2.1% increase relative to the same period in 2019
- For the week ending September 25, there were 67,407 listings that went under contract nationwide
-
Percentage of total contract volume since the week ending March 13, broken down by home price:
- $0-$200k: 23.5%
- $200k-$400k: 44.9%
- $400k-$600k: 17.4%
- $600k-$1mm: 9.7%
- >$1mm: 4.5%
Median Listing Price Activity (Single-Family Detached Homes):
-
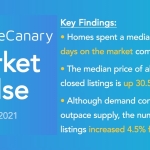
39 states are experiencing higher median prices of closed listings since the onset of the pandemic, with 19 states continuing to climb week-over-week
-
The states with the most significant closed listing price increases since the pandemic’s onset include:
- Vermont: +29.4%
- Connecticut: +29.3%
- New Jersey: +26.9%
- The most significant week-over-week closed listing price increase was in New York, with prices rising 4.7%.
-
The states with the most significant closed listing price increases since the pandemic’s onset include:
As a nationwide real estate broker, HouseCanary’s broad multiple listing service (“MLS”) participation allows us to evaluate listing data and aggregate the number of new listings as well as the number of new listings going into contract for all single-family detached homes observed in the HouseCanary database. Using this data, HouseCanary continues to track listing volume, new listings, and median list price for 41 states and 50 individual Metropolitan Statistical Areas (“MSAs”).
About HouseCanary:
Founded in 2013, valuation-focused real estate brokerage HouseCanary provides software and services to reshape the real estate marketplace. Financial institutions, investors, lenders, mortgage investors, and consumers turn to HouseCanary for industry-leading valuations, forecasts, and transaction-support tools. These clients trust HouseCanary to fuel acquisition, underwriting, portfolio management, and more. Learn more at www.housecanary.com.
Contacts
Denise Dunckel
press@housecanary.com