
")
SANTA MONICA, Calif.--(BUSINESS WIRE)--Institutional assets tracked by Wilshire Trust Universe Comparison Service® (Wilshire TUCS®) posted all-plan median returns of 8.26 and 4.21 percent, respectively, for first quarter and the year ending March 31, 2019. Wilshire TUCS, a cooperative effort between Wilshire Analytics, the investment technology foundation of Wilshire Associates (Wilshire®), and custodial organizations, is widely considered the definitive benchmark for U.S. institutional plan assets performance and allocation.
A dismal 2018 fourth quarter rebounded to cement first quarter 2019 as best in nearly a decade, since third quarter 2009. Meanwhile, one-year returns remain low.
“Nearly all asset classes delivered healthy returns for institutional investors during the first quarter,” said Jason Schwarz, president, Wilshire Analytics and Wilshire Funds Management. “Government bonds were buoyed by expectations of lower interest rates extending for a longer period of time. This was also supportive of riskier assets such as high yield bonds and equities, which rallied substantially higher off low valuations at the end of 2018.”
U.S. equities, represented by the Wilshire 5000 Total Market Index℠, rose 14.11 and 8.93 percent first quarter and for the year, respectively; and, international equities, represented by the MSCI AC World ex U.S., also rose 10.31, but fell -4.22 percent first quarter and for the year, respectively. U.S. bonds, represented by the Wilshire Bond Index℠, increased first quarter with a gain of 4.03 and 5.17 percent for the quarter and year, respectively.
Median ranges across plan types for the quarter spanned gains from 6.32 to 8.93 percent for Taft Hartley Health and Welfare Fund and Taft Hartley defined benefit plans, respectively. One-year medians ranged from gains of 3.87 to 4.70 percent for foundations and endowments, and for large corporate funds (assets above $1 billion), respectively.
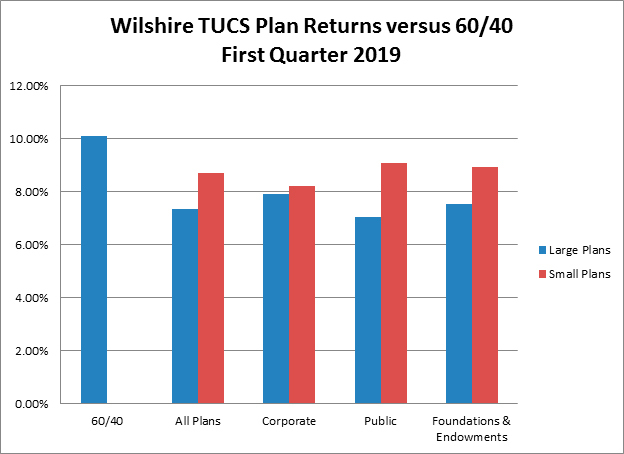
For the quarter, all plan types underperformed the 60/40 portfolio, which gained 10.08 percent.
Large plans (assets above $1 billion) posted median gains of 7.34 and 4.60 percent for the quarter and year ending March 31, respectively; meanwhile, small plans (assets less than $1 billion), outperformed large for the quarter but not the year at 8.69 and 4.06 percent, respectively.
Data and charts in this article are copyrighted and owned by Wilshire Associates Incorporated.
About Wilshire Associates
Wilshire Associates, a leading global financial services firm, provides consulting services, analytics solutions and customized investment solutions to plan sponsors, investment managers and financial intermediaries. Its business units include, Wilshire Analytics, Wilshire Consulting, Wilshire Funds Management and Wilshire Private Markets. The firm was founded in 1972, providing revolutionary technology and acting as an early innovator in the application of investment analytics and research to investment managers in the institutional marketplace. Wilshire also is credited with helping to develop the field of quantitative investment analysis that uses mathematical tools to analyze market risks. All other business units evolved from Wilshire’s strong analytics foundation. Wilshire developed the Wilshire 5000 Total Market Index and became an early innovator in creating integrated asset/liability analysis/simulation models as well as practical models in risk budgeting through beta and active risk analysis. Wilshire has grown to a firm of approximately 270 employees serving the needs of investors around the world. Based in Santa Monica, California, Wilshire provides services to clients in more than 20 countries representing more than 500 organizations with assets totaling approximately US $9 trillion.* With ten offices worldwide, Wilshire Associates and its affiliates are dedicated to providing clients with the highest quality products and services. Wilshire® and Wilshire 5000® are registered service marks of Wilshire Associates Incorporated. Wilshire 5000 Total Market Index℠ is a service mark of Wilshire Associates Incorporated.
Please visit www.wilshire.com
Twitter:
@WilshireAssoc
*Client assets are as represented by Pensions & Investments (P&I), detailed in P&I’s “Largest Retirement Funds” and P&I’s “Largest Money Managers (U.S. institutional tax-exempt assets)” as of 9/30/17 and 12/31/17, and published 2/5/18 and 5/28/18, respectively.
Data and charts in this article are copyrighted and owned by Wilshire Associates Incorporated.