

Newsroom
Sorted by: Latest
-
Deadline Soon: Picard Medical, Inc. (PMI) Shareholders Who Lost Money Urged To Contact The Law Offices of Frank R. Cruz About Securities Fraud Lawsuit
LOS ANGELES--(BUSINESS WIRE)--The Law Offices of Frank R. Cruz reminds investors of the upcoming April 3, 2026 deadline to participate as a lead plaintiff in the securities fraud class action lawsuit filed on behalf of investors who acquired Picard Medical, Inc. (“Picard” or the “Company”) (NYSE American: PMI) securities between September 2, 2025 and October 31, 2025, inclusive (the “Class Period”).IF YOU ARE AN INVESTOR WHO LOST MONEY ON PICARD MEDICAL, INC. (PMI), CLICK HERE TO PARTICIPATE IN...
-
TISC Makes a Full-Court Press Ahead of Final Four, Appoints Richard “Scooter” Barry as Vice President of Sports
SAN FRANCISCO--(BUSINESS WIRE)--TISC Makes a Full-Court Press Ahead of Final Four, Appoints Richard “Scooter” Barry as Vice President of Sports...
-
The American Train Dispatchers Association and Union Pacific Railroad Reach Agreement to Protect Union Jobs for Life
OMAHA, Neb.--(BUSINESS WIRE)--The American Train Dispatchers Association (ATDA) and Union Pacific Railroad reached an agreement that guarantees jobs for life for union employees after Union Pacific and Norfolk Southern combine to create America’s first single-line, coast-to-coast railroad. The ATDA is the latest union to reach this historic agreement with Union Pacific that ensures employees who are employed at the time of the merger will have job security for life, subject to the usual require...
-
Fortive Schedules First Quarter 2026 Earnings Conference Call
EVERETT, Wash.--(BUSINESS WIRE)--Fortive Corporation (“Fortive”) (NYSE: FTV) today announced that it will webcast its earnings conference call for the first quarter 2026 on Thursday, April 30, 2026, beginning at 12:00 p.m. ET and lasting approximately one hour. The call and an accompanying presentation will be webcast on the "Investors" section of Fortive’s website, www.fortive.com, under "News & Events". You can access the conference call by dialing 877-407-3110 within the U.S. or +1 215-2...
-
WaFd Bank Named Official Banking Partner of Network of Giving Foundation Across the United States
SEATTLE--(BUSINESS WIRE)--WaFd Bank and its holding company WaFd, Inc. (Nasdaq: WAFD) today announced that it is the official banking partner for Network of Giving across the United States, supporting the continued national expansion of the purpose-driven digital commerce and community impact ecosystem. This partnership brings together the Network of Giving Foundation’s governance and the Network of Giving’s platform’s patented, philanthropic driven technology with WaFd Bank’s trusted financial...
-
WellStack Partners with Healthcare Systems of America to Establish a Unified Data Foundation and Enable Enterprise Analytics
MADISON, Wis.--(BUSINESS WIRE)--WellStack, a healthcare data platform purpose-built to enable analytics, AI readiness, and confident decision-making, today announced a multi-year strategic partnership with Healthcare Systems of America (HSA), a leading hospital services organization supporting health systems nationwide across acute and specialty care environments. This partnership reflects a shared vision for leveraging data, analytics, and AI to drive greater operational visibility, financial...
-
Calix Named Among Fortune 100 Best Companies to Work For as Agentic Leadership Advances
SAN JOSE, Calif.--(BUSINESS WIRE)--Today, Calix, Inc. (NYSE: CALX) announced it has ranked 85th on the Fortune 100 Best Companies to Work For® 2026 list. The listing also ranks Calix 21st in Best Large Workplaces in Tech, 18th in the Bay Area, and 67th for Parents. This recognition reflects Calix’s award-winning, customer‑first culture and accelerating business momentum. Founded 26 years ago to serve communications service providers (CSPs), Calix evolved over the past 15 years into a software‑l...
-
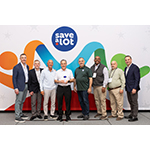
Save A Lot recognizes 10 Retail Partners at Annual Meeting
ST. LOUIS--(BUSINESS WIRE)--Save A Lot, one of the largest discount grocery chains in the U.S., today announced the accomplishments of 10 of its Retail Partners, sharing the names of the owners and operators honored at the company’s annual Retail Partner Awards. The awards were presented during the Company’s annual meeting and food show for store owners and operators, held in St. Charles, Mo. Awards were given to recognize performance in calendar year 2025 across several major categories, inclu...
-
Corporate Partner Arman Pahlavan Joins Dorsey in Palo Alto
PALO ALTO, Calif.--(BUSINESS WIRE)--Arman Pahlavan has joined Dorsey & Whitney LLP as a Partner in the Emerging Companies group in Palo Alto, the international law firm announced today. A leading Silicon Valley attorney, Arman focuses his corporate practice on advising emerging companies and the investors who back them, including venture capital funds, private equity firms, and public and private portfolio companies. His deal work spans special purpose acquisition companies (SPAC)-related M...

-
Dynasty Financial Partners Named Official Wealth Management Partner of the United Football League
ST. PETERSBURG, Fla.--(BUSINESS WIRE)--Dynasty Financial Partners today announced its new role as the Official Wealth Management Partner of the United Football League (UFL). This partnership unites two organizations defined by bold thinking, entrepreneurial spirit, and a shared commitment to rewriting what's possible — on the field and beyond. A Partnership Built on Shared Vision Mike Repole, UFL Co-Owner, expressed his enthusiasm for the new relationship: “When choosing a wealth management par...