

Newsroom
Sorted by: Latest
-
Resumen: IQM anuncia un novedoso enfoque de corrección de errores cuánticos para la computación cuántica resistente a fallos
MÚNICH Y ESPOO, Finlandia--(BUSINESS WIRE)--IQM Quantum Computers, líder internacional en ordenadores cuánticos superconductores, ha desarrollado un novedoso código de corrección de errores cuánticos que logra tasas de error lógico hasta tres veces menores que el código de superficie, además de requerir hasta ocho veces menos qubits físicos. A diferencia de muchos otros enfoques alternativos de corrección de errores cuánticos de alto rendimiento, el nuevo código también presenta una complejidad...

-
Riassunto: IQM annuncia un nuovo approccio alla correzione degli errori quantistici per un calcolo quantistico tollerante dei guasti
MONACO ed ESPOO, Finlandia--(BUSINESS WIRE)--IQM Quantum Computers, il leader globale nei computer quantistici a superconduttori, ha sviluppato un nuovo codice per la correzione degli errori quantistici che permette di ottenere percentuali di errore logico inferiori fino a tre ordini di grandezza rispetto al codice di superficie, richiedendo inoltre fino a otto volte meno qubit fisici. A differenza di molti approcci alla correzione degli errori quantistici alternativi e ad alte prestazioni, il...
-
IQM、耐障害性量子コンピューティングに向けた新たな量子誤り訂正手法を発表
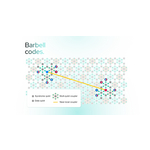
フィンランド、ミュンヘン・エスポー--(BUSINESS WIRE)--(ビジネスワイヤ) -- 超伝導量子コンピューター分野のグローバルリーダーであるIQMクオンタム・コンピューターズ(以下「IQM」)は、サーフェスコードと比較して最大3桁低い論理エラー率を達成しながら、必要な物理量子ビット数を最大8分の1まで削減できる新たな量子誤り訂正コードを開発したと発表しました。 多くの高性能な代替量子誤り訂正手法とは異なり、この新コードは比較的低いハードウェア複雑性も維持しており、スケーラブルな耐障害性量子コンピューティングの実現に向けた重要な前進となります。 量子誤り訂正は、実用的な量子コンピューティング実現競争における最大の課題の一つとされています。ノイズによって生じる誤りは、蓄積される速度を上回るペースで修正される必要がありますが、従来の手法では、複雑なハードウェア構成、あるいは性能面での大幅なトレードオフが求められていました。IQMの新コードは、これら両方の制約を同時に解決するものです。 IQMの画期的技術である「barbell codes(バーベルコード)」は、量子低密度パリティ...

-
IQM宣布推出針對容錯量子運算的新型量子錯誤更正方法
慕尼黑和芬蘭埃斯波--(BUSINESS WIRE)--(美國商業資訊)-- 全球超導量子電腦領軍企業IQM Quantum Computers研發出一種新型量子錯誤更正碼。相較傳統的表面碼,該錯誤更正碼可將邏輯錯誤率降低多達三個數量級,且所需的實體量子位元數量最多可減少八倍。 與許多其他高效能量子錯誤更正方法不同,這種新程式碼還保持了相對較低的硬體複雜度,這代表向可擴充的容錯量子運算邁出了重要一步。 量子錯誤更正仍然是邁向實用化量子運算的核心挑戰之一。由雜訊引進的錯誤必須在它們累積之前被糾正,而以往的方法要麼需要複雜的硬體,要麼必須做出巨大的效能妥協來滿足這一要求。IQM的程式碼同時解決了這兩項限制條件。 IQM的這項被稱為「杠鈴碼」(barbell codes)的突破性技術屬於量子低密度同位元檢查碼(QLDPC)系列,專為IQM的Constellation架構量身打造。這是一種獨特的量子處理器拓撲結構,具有強化的平面連線性,其中每個量子位元能夠與12個其他量子位元進行原生互動,而傳統方形網格拓撲中僅能與4個量子位元互動。同時,它只需為運算量子位元配備3個耦合器,為中心元件配備6個耦...

-
IQM宣布推出面向容错量子计算的新型量子纠错方法
慕尼黑和芬兰埃斯波--(BUSINESS WIRE)--(美国商业资讯)-- 全球超导量子计算机领军企业IQM Quantum Computers研发出一种新型量子纠错码。与传统的表面码相比,该纠错码可将逻辑错误率降低多达三个数量级,且所需的物理量子比特数量最多可减少八倍。 与许多其他高性能量子纠错方法不同,这种新代码还保持了相对较低的硬件复杂度,这标志着向可扩展的容错量子计算迈出了重要一步。 量子纠错仍然是迈向实用化量子计算的核心挑战之一。由噪声引入的错误必须在它们累积之前被纠正,而以往的方法要么需要复杂的硬件,要么必须做出巨大的性能妥协来满足这一要求。IQM的代码同时解决了这两项限制条件。 IQM的这项被称为“杠铃码”(barbell codes)的突破性技术属于量子低密度奇偶校验码(QLDPC)系列,专为IQM的Constellation架构量身定制。这是一种独特的量子处理器拓扑结构,具有增强的平面连接性,其中每个量子比特能够与12个其他量子比特进行原生交互,而传统方形网格拓扑中仅能与4个量子比特交互。同时,它只需为计算量子比特配备3个耦合器,为中心元件配备6个耦合器。 通过充分...

-
Aldeyra Therapeutics Appoints Darlene Deptula-Hicks to Board of Directors
LEXINGTON, Mass.--(BUSINESS WIRE)--Aldeyra Therapeutics, Inc. (Nasdaq: ALDX) (Aldeyra), a biotechnology company devoted to discovering and developing innovative therapies designed to treat immune-mediated diseases, today announced the appointment of Darlene Deptula-Hicks to Aldeyra’s board of directors (the Board). “Ms. Deptula-Hicks brings decades of experience working with both publicly traded and venture-backed biotechnology companies,” stated Richard H. Douglas, Ph.D., Chairman of the Board...
-
Samenvatting: Avanzanite breidt uit naar Spanje en benoemt María Baquerizo tot Country Manager
AMSTERDAM--(BUSINESS WIRE)--Avanzanite Bioscience B.V., een snel groeiend Europees bedrijf dat gespecialiseerde farmaceutica produceert met bijzondere aandacht voor zeldzame ziekten, kondigde vandaag de uitbreiding van de activiteiten naar Spanje aan en de benoeming van María Baquerizo López-Quectuy tot Spain Country Manager. Dit volgt na een Serie A-investering van €32 miljoen door MVM Partners aangekondigd in november 2025 en de recente toegang in Frankrijk. Avanzanite blijft zijn geïntegreer...

-
Avanzanite expandiert nach Spanien und ernennt María Baquerizo zur Managerin für das Land
AMSTERDAM--(BUSINESS WIRE)--Avanzanite Bioscience B.V. ist ein schnell wachsendes europäisches Pharmazieunternehmen für die kommerzielle Phase, das auf seltene Krankheiten spezialisiert ist. Es gab heute bekannt, dass es nach Spanien expandiert und María Baquerizo López-Quectuy als Managerin für dieses Land ernennt. Dieser Schritt folgt auf ein Series-A-Investment in Höhe von €32 Millionen durch MVM Partners , das im November 2025 bekannt wurde und dem Eintritt in den französischen Markt. Avanz...

-
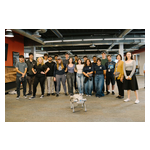
Faraday Future Welcomes Students From El Segundo School District’s High School STEM Program to Its Global HQ to Discover More About the Company’s Latest EAI Robotics, Steadily Making Progress in Building the EAI Education Ecosystem
LOS ANGELES--(BUSINESS WIRE)--Faraday Future Intelligent Electric Inc. (NASDAQ: FFAI) (“Faraday Future”, “FF” or the “Company”), a California-based global Embodied AI (EAI) ecosystem company, welcomed students and faculty from El Segundo (CA) High School’s STEM program to its Global headquarters on June 4, 2026. The students participated in a number of activities including: viewing the Company’s FF 91 and FX Super One EV’s; having a tour of the Company’s new HQ facility in El Segundo, including...
-
Affinity Interactive Support Transition of Primm Valley Casino Resorts
LAS VEGAS--(BUSINESS WIRE)--Affinity Interactive ("Affinity") today acknowledged the announced agreement regarding the future operation of Primm Valley Casino Resorts and their transition to the Herbst family. "We have worked constructively with the Primm family and the Nevada Gaming Control Board to date and are very encouraged by the progress being made toward the transition of Primm Valley Casino Resorts to the Herbst family," said Scott Butera, Chief Executive Officer of Affinity Interactiv...