

Newsroom
Sorted by: Latest
-
Pierre & Vacances-Center Parcs : Chiffre d’affaires du 3ème trimestre de l’exercice 2025/2026
PARIS--(BUSINESS WIRE)--Hausse du chiffre d’affaires économique des activités touristiques de 2,2% au 3ème trimestre 2025/2026....

-
Pierre & Vacances-Center Parcs: Third Quarter 2025/2026 Revenue
PARIS--(BUSINESS WIRE)--Regulatory News: Franck Gervais, CEO of Pierre & Vacances-Center Parcs (Paris:VAC), stated: “Growth in the Group’s tourism businesses continued over the quarter driven by all of the brands. Against a tense international backdrop, these results confirm the robust and resilient nature of our local tourism model as favoured by our customers whose satisfaction ratings were up across all of our brands. Reservations for the summer period are strong, underpinned especially...

-
Havas Reports Solid H1 2026 Results With Organic Growth of +2.5% and Further Improvement in Adjusted EBIT Margin
PARIS--(BUSINESS WIRE)--Havas reports solid H1 2026 results with organic growth of +2.5% and further improvement in adjusted EBIT margin...
-
Resumen: Los coros infantiles de Taiwán arrasan en un concurso coral en Hungría
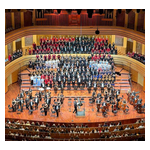
TAIPÉI, Taiwán--(BUSINESS WIRE)--En la competencia con 36 participantes destacados de 20 países, cuatro coros infantiles taiwaneses han ganado varios premios importantes y honores máximosen la V Edición del Festival Coral Internacional de Budapest, poniendo de manifiesto la diversidad cultural y la excelencia musical de Taiwán. Con sus voces diáfanas y angelicales y una excelente técnica vocal, el Coro Infantil Puzangalan, del condado de Pingtung, se alzó con el máximo galardón, el "Laurea Summ...
-
Riassunto: I cori di voci bianche di Taiwan vincono premi importanti al concorso ungherese di cori
TAIPEI, Taiwan--(BUSINESS WIRE)--Nella competizione tra 36 cori provenienti da 20 Paesi, quattro cori di voci bianche da Taiwan hanno conquistato vari importanti premi e riconoscimenti alla 5a edizione del Budapest International Choral Celebration, il festival internazionale di cori di Budapest, dimostrando la diversità culturale e l'eccellenza musicale di Taiwan. Con voci pure e angeliche e straordinarie tecniche vocali, il Puzangalan Children’s Choir di Pingtung County si è aggiudicato il pri...

-
Samenvatting: Taiwanese kinderkoren behalen belangrijke awards op Hongaarse koorwedstrijd
TAIPEI, Taiwan--(BUSINESS WIRE)--In een wedstrijd tegen 36 vooraanstaande mededingers uit 20 landen hebben vier Taiwanese kinderkoren verschillende belangrijke awards en toponderscheidingen behaald tijdens de 5e Budapest International Choral Celebration, een getuigenis van de culturele diversiteit en muzikale uitmuntendheid van Taiwan. Met hun zuivere, engelachtige stemmen en uitzonderlijke stemtechnieken won het Puzangalan Children’s Choir uit Pingtung County de hoofdprijs, Laurea Summa Cum La...

-
Taiwanesische Kinderchöre gewinnen wichtige Preise bei ungarischem Chorwettbewerb
TAIPEH, Taiwan--(BUSINESS WIRE)--Im Wettbewerb mit 36 führenden Teilnehmern aus 20 Ländern haben vier taiwanesische Kinderchöre beim 5. Internationalen Chorfestival in Budapest mehrere bedeutende Preise und höchste Auszeichnungen gewonnen und damit Taiwans kulturelle Vielfalt und musikalische Exzellenz unter Beweis gestellt. Mit seinen reinen, engelsgleichen Stimmen und seiner außergewöhnlichen Gesangstechnik gewann der Puzangalan-Kinderchor aus dem Landkreis Pingtung den Hauptpreis „Laurea Sum...

-
Des chorales d’enfants taïwanaises remportent des prix prestigieux lors d’un concours choral hongrois
TAIPEI, Taïwan--(BUSINESS WIRE)--En compétition face à 36 participants de premier plan provenant de 20 pays, quatre chorales d’enfants taïwanaises ont remporté plusieurs prix prestigieux et les plus hautes distinctions lors de la 5e Édition de la Célébration chorale internationale de Budapest, mettant ainsi en valeur la diversité culturelle et l’excellence musicale de Taïwan. Grâce à leurs voix pures et angéliques ainsi qu’à leurs techniques vocales exceptionnelles, la chorale d’enfants Puzanga...

-
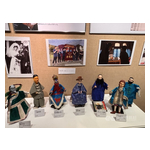
早稲田大学坪内博士記念演劇博物館にて「台湾人形劇文化月間」が開幕
台湾・台北--(BUSINESS WIRE)--(ビジネスワイヤ) -- 東京の台湾文化センターは、早稲田大学および同大学坪内博士記念演劇博物館と共同で、7月3日から8月2日まで「台湾人形劇文化月間」を開催しています。本プログラムの目玉は、1934年に台湾人卒業生から寄贈された人形劇の舞台である「楽花園」の彩楼(飾り舞台)であり、1996年の展示以来、初めての一般公開となります。 本プログラム開催のきっかけは、亦宛然掌中劇団が2024年に行った日本公演にさかのぼります。同劇団は早稲田大学での公演に際し、演劇博物館に収蔵されている「楽花園」の彩楼の見学を希望していましたが、当時は一般公開されていませんでした。それ以降、台湾文化センター、坪内博士記念演劇博物館、そして亦宛然掌中劇団が共同で尽力し、今回の「台湾人形劇文化月間」が実現に至りました。 本プログラムを通じて開幕した「台湾人形劇展」は、坪内博士記念演劇博物館の創立100周年記念事業の一環としても位置づけられています。同館は演劇専門の博物館の草分けとして広く知られており、世界中の膨大なコレクションと演劇研究における先駆的な資料を有す...
-
Agentic AI Reshapes Property, Casualty Insurance Operations
STAMFORD, Conn.--(BUSINESS WIRE)--Property and casualty insurers worldwide are redesigning operations around AI-enabled decision workflows and adaptive operating models, ISG says....