Newsroom
Sorted by: Latest
-
Tentative agreement reached for striking long term care workers
Halifax--(BUSINESS WIRE)--A tentative agreement has been reached between the Canadian Union of Public Employees (CUPE) Local 1082 and St. Vincents Nursing Home. CUPE 1082 is the Lead Table in bargaining, responsible for negotiating terms that impact other bargaining tables, including setting the economic pattern for CUPE members in the long term care sector in Nova Scotia. Details of the tentative agreement will not be shared until members have had the opportunity to review and ratify the terms...
-
Corcept Presents New Data at ADA: Improved Outcomes in Patients Receiving a GLP-1 with Difficult-to-Control Type 2 Diabetes and Hypercortisolism Treated with Korlym®
REDWOOD CITY, Calif.--(BUSINESS WIRE)--Corcept Therapeutics Incorporated (NASDAQ: CORT), a commercial-stage company engaged in the discovery and development of medications to treat severe endocrinologic, oncologic, metabolic and neurologic disorders by modulating the effects of the hormone cortisol, today announced the presentation of new data from its CATALYST and MOMENTUM trials at the American Diabetes Association’s 86th Scientific Sessions. The presentations underscore the critical role of...
-
SES AI Corporation Class Action Reminder - Robbins LLP Encourages SES Investors to Contact the Firm for Information About Their Rights
SAN DIEGO--(BUSINESS WIRE)--A class action was filed on behalf of all investors who purchased or otherwise acquired SES AI Corporation (NYSE: SES) securities between January 29, 2025 and March 4, 2026. SES claims to be a "leading developer and manufacturer of high-performance, AI-enhanced Lithium-Metal (“Li-Metal”) and Lithium-ion (“Li-ion”) rechargeable battery technologies and battery materials for Energy Storage Systems (“ESS”), Urban Air Mobility (“UAM”), drones, robotics, electric vehicles...

-
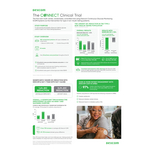
Dexcom CONNECT Study: The Most Significant Clinical Study Demonstrating CGM Benefits for People with Type 2 Diabetes Not Using Insulin
SAN DIEGO--(BUSINESS WIRE)--DexCom, Inc. (NASDAQ:DXCM) announced today results from the CONNECT randomized controlled trial, demonstrating the use of Dexcom G7 leads to clinically and statistically significant reduction in A1C and improvement in glucose control among people with Type 2 diabetes not using insulin compared with a routine care control group using self-monitoring of blood glucose.1 Researchers presented these results today as an oral presentation at the 2026 Scientific Sessions of...
-
Kalloghlian Myers LLP: Potential Investor Class Action Against TerraVest Industries Inc.
TORONTO--(BUSINESS WIRE)--Kalloghlian Myers LLP is investigating a potential investor class action against TerraVest Industries Inc. (TSE: TVK). On June 5, 2026, TerraVest shares fell 31.6% following allegations that executive chairman Charles Pellerin tipped off family members and acquaintances ahead of a major acquisition announcement. The Journal de Montréal reported that Québec’s financial regulator obtained a search warrant, citing allegations that Pellerin communicated privileged informat...
-
Robust Phase 2b Efficacy and Favorable Tolerability Support Monthly Dosing for Pfizer’s GLP-1 RA Berobenatide
NEW YORK--(BUSINESS WIRE)--Pfizer Inc. (NYSE: PFE) today presented detailed results from multiple Phase 2b studies of berobenatide (PF’3944), an investigational, potential first-in-class monthly GLP-1 receptor agonist (GLP-1 RA) peptide, during a late-breaking expert symposium at the 86th Scientific Sessions of the American Diabetes Association (ADA). The objectives for the Phase 2 studies were to identify the right doses for Phase 3 and to test escalation schemes. Across both weekly and monthl...
-
Insulet Reveals New Data Supporting Breakthrough Omnipod® 6 and Fully Closed-Loop AID Systems Designed to Improve Outcomes, Reduce Effort, and Unlock Barriers to Care
ACTON, Mass.--(BUSINESS WIRE)--Insulet Reveals New Data Supporting Breakthrough Omnipod® 6 and Fully Closed-Loop AID Systems Designed to Improve Outcomes, Reduce Effort...
-
DFNS renueva su marca como plataforma de banca central para activos digitales
PARÍS--(BUSINESS WIRE)--DFNS anunció hoy una renovación de marca que representa su evolución de una infraestructura de billetera a la primera plataforma de banca central para activos digitales. La empresa está presentando un nuevo logotipo, sitio web y posicionamiento en el mercado, en un contexto donde las fintech y las instituciones trasladan sus productos y operaciones a la cadena de bloque. Bancos, fintechs, administradores de activos, firmas bursátiles, proveedores de pagos, infraestructur...

-
NUBURU amplia la piattaforma Defense & Security con l'iniziativa Laser Arm che punta ai mercati in rapida crescita dell'energia diretta e dei sistemi anti-UAS
DENVER--(BUSINESS WIRE)--NUBURU, Inc. (NYSE American: BURU – la "Società"), la società creatrice della piattaforma integrata di prossima generazione a doppio utilizzo Defense & Security che si concentra sugli effetti non cinetici e sulle tecnologie a energia diretta, sui programmi di guerra elettronica e di mobilità nel settore della difesa, dei sistemi di difesa orchestrati da software e produzione avanzata, ha annunciato oggi la firma di un accordo preliminare vincolante (l'"Accordo") con...
-
DFNS、デジタル資産向けコアバンキングプラットフォームとしてリブランディングを実施
パリ--(BUSINESS WIRE)--(ビジネスワイヤ) -- DFNSは、ウォレットインフラからデジタル資産向け初のコアバンキングプラットフォームへと進化を遂げるリブランディングを発表しました。フィンテック企業や金融機関が製品や業務をオンチェーンに移行する中、DFNSは新しいロゴ、ウェブサイト、そして市場において新たなポジショニングを実施します。 銀行、フィンテック企業、資産運用会社、トレーディング会社、決済プロバイダー、市場インフラ、そしてクリアリングハウスは、「暗号資産をどう追加するか」とは問わなくなっています。これらの組織が求めているのは、コアインフラに求められる信頼性を備えつつ、金融商品、管理体制、ワークフロー、そして顧客サービスをブロックチェーン上でどのように運用するかという問いへの答えです。さらに一歩進み、ブロックチェーン自体を台帳として活用できる可能性を探る組織も出始めています。つまり、口座はデータベースの行ではなく、オンチェーン上のオブジェクトとして扱われるということです。つまり、IBAN、仮想口座、そしてブロックチェーンウォレットが、1つの統制された金融口座に...