

Newsroom
Sorted by: Latest
-
CoreWeave Introduces a New Brand Vision As the Cloud Built for This Moment
LIVINGSTON, N.J.--(BUSINESS WIRE)--CoreWeave, Inc. (Nasdaq: CRWV), The Essential Cloud for AI™, today debuted its first integrated brand campaign, “Ready for Anything, Ready for AI.” Featuring Chance the Rapper, the campaign marks a new brand vision centered on empowering pioneers investing in AI to push boundaries and accelerate breakthroughs in AI innovation. As the AI industry shifts from experimentation to large-scale production, CoreWeave’s new campaign highlights the company’s unique posi...

-
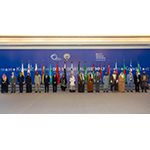
La DCO finaliza su 5.a Asamblea General con la adopción de la Declaración de Kuwait sobre la IA responsable para la prosperidad digital mundial
CIUDAD DE KUWAIT--(BUSINESS WIRE)--La Organización para la Cooperación Digital (Digital Cooperation Organization, DCO) ha dado por concluida su quinta Asamblea General, en la que los Estados miembros adoptaron la Declaración de Kuwait sobre la IA responsable para la prosperidad digital mundial y acordaron medidas para promover una transformación digital inclusiva, confiable y escalable en la era de la IA. Convocada los días 4 y 5 de febrero de 2026 bajo la presidencia del Estado de Kuwait, la A...
-
A DCO conclui a 5ª Assembleia Geral com a adoção da Declaração do Kuwait sobre IA Responsável para a Prosperidade Digital Global
KUWAIT CITY--(BUSINESS WIRE)--A Organização de Cooperação Digital (DCO) concluiu sua quinta Assembleia Geral, com os Estados-membros adotando a Declaração do Kuwait sobre IA Responsável para a Prosperidade Digital Global e concordando com ações para promover uma transformação digital inclusiva, confiável e escalável na era da IA. Convocada nos dias 4 e 5 de fevereiro de 2026 sob a presidência do Estado do Kuwait, a Assembleia Geral reuniu ministros e representantes dos Estados-membros, juntamen...

-
DCO schließt die 5. Generalversammlung mit der Verabschiedung der Kuwait-Erklärung zu verantwortungsvoller KI für globalen digitalen Wohlstand ab
KUWAIT-STADT--(BUSINESS WIRE)--Die Digital Cooperation Organization (DCO) hat ihre fünfte Generalversammlung abgeschlossen. Die Mitgliedstaaten verabschiedeten die Kuwait-Erklärung zu verantwortungsvoller KI für globalen digitalen Wohlstand und vereinbarten Maßnahmen zur Förderung einer inklusiven, vertrauenswürdigen und skalierbaren digitalen Transformation im KI-Zeitalter. Die Generalversammlung fand am 4. und 5. Februar 2026 unter dem Vorsitz des Staates Kuwait statt und führte Minister und...

-
数字合作组织第五届 大会闭幕,通过《关于促进全球数字繁荣的负责任人工智能的科威特宣言》
科威特城--(BUSINESS WIRE)--(美国商业资讯)-- 数字合作组织(DCO)第五届大会闭幕,成员国通过了《关于促进全球数字繁荣的负责任人工智能的科威特宣言》,同意在人工智能时代采取行动促进包容、可信和可扩展的数字化转型。 本届大会于2026年2月4–5日举行,由科威特国担任主席,与会者包括成员国以及观察员国、合作伙伴国和嘉宾国的部长和代表。大会审议了数字合作组织四年议程(2025–2028)的完成进度,就若干多边倡议做出了共同决定,将有关人工智能的共同宏伟目标变为现实。 各国部长和代表重申对建设包容、有韧性和可持续的数字化转型的承诺。《宣言》认可了人工智能在提高生产率、竞争力和公共服务交付方面的潜力,同时也强调需要建立伦理治理架构来解决与不平等、偏见、隐私和安全性有关的风险,再次确认数字合作组织在四年议程下为所有人建设数字繁荣的使命。 成员国认可加速可信数字增长的政策与实施框架,包括《示范数字经济协议》,以及旨在促进可信跨境数据流动的文件。成员国注意到在若干旗舰倡议方面取得的进步,涵盖数字经济计量、数字主权、初创企业监管、数字政府解决方案、投资促进、符合道德的人工智能、人...

-
數位合作組織第五屆大會落幕,表決通過《科威特負責任AI促進全球數位繁榮宣言》
科威特城--(BUSINESS WIRE)--(美國商業資訊)-- 數位合作組織(DCO)第五屆大會順利閉幕,各會員國表決通過《科威特負責任AI促進全球數位繁榮宣言》,並就AI時代推進包容、可信且可規模化的數位化轉型達成行動共識。 本屆大會於2026年2月4日至5日在科威特國輪值主席國期間召開,會員國相關部長及代表、觀察員、合作夥伴與嘉賓國齊聚一堂,審議DCO 2025-2028四年議程落實進展,就多邊倡議做出共同決策,並將各方在AI領域的共同願景轉化為具體行動方案。 部長及代表們重申了對包容、有韌性的永續數位化轉型的承諾。該宣言肯定AI在推動生產力提升、強化競爭力和改善公共服務水準方面的潛力,同時強調需建立倫理治理體系,以應對不平等、偏見、隱私和安全相關風險,並重申DCO在四年議程下實現「全民數位繁榮」的使命。 會員國肯定了多項旨在加快可信數位發展的政策與實施架構,包括《數位經濟協議範本》,以及保障可信跨境資料流動的相關機制文件。各會員國注意到,涵蓋數位經濟衡量、資料主權、新創企業監管、數位政府解決方案、投資便利化、AI倫理、AI適配能力建設、女性領軍中小微企業發展、數位技能、網路安...

-
DCO、 デジタル協力機構、デジタルのグローバルな繁栄のための責任あるAIに関するクウェート宣言を採択し、第5回総会を閉幕
クウェートシティ--(BUSINESS WIRE)--(ビジネスワイヤ) -- デジタル協力機構(DCO)の第5回総会は閉幕を迎え、加盟国が「デジタルのグローバルな繁栄のための責任あるAIに関するクウェート宣言」を採択し、AIの時代において包括的かつ高信頼性、そして拡張可能なデジタル変革を推進するための行動に合意しました。 議長国クウェートのもと2026年2月4日から5日まで開催された総会には、加盟国の閣僚および代表者、オブザーバー、パートナー、特別参加国代表者が一堂に会し、DCO4か年アジェンダ(2025~2028年)の進捗を確認するとともに、国家間イニシアチブに関する共同での決定を行い、AIに関する共通の意向を実施段階へと移しました。 各国の閣僚および代表者は、インクルーシブかつレジリエント、さらに持続可能なデジタル変革へのコミットメントを再確認しました。採択された宣言は、AIが生産性、競争力、そして公共サービスの提供を促進する可能性を認識するとともに、不平等、偏見、プライバシー、そしてセキュリティのリスクに対処する倫理的ガバナンスの必要性を強調しつつ、4か年アジェンダにおける「...

-
Changan dá início à Temporada Global de Testes 2026 com atualização da Inteligência SDA e estratégia de baterias de sódio-íon
YAKESHI, China--(BUSINESS WIRE)--A Changan Automobile realizou um evento de lançamento com o tema “Atualização da Inteligência SDA da Changan e Lançamento Global da Estratégia de Baterias de Sódio-Íon”, na cidade de Yakeshi, Mongólia Interior. Durante o evento, a Changan apresentou oficialmente sua estratégia global para baterias de sódio-íon e anunciou o início da Temporada Global de Testes 2026. A Changan está acelerando o desenvolvimento da tecnologia de baterias de sódio-íon como parte de s...
-
Changan Launches 2026 Global Testing Season with SDA Intelligence Update and Sodium-Ion Battery Strategy
YAKESHI, China--(BUSINESS WIRE)--Changan Automobile held a release event themed “Changan SDA Intelligence Update & Global Launch of Sodium-Ion Battery Strategy” in Yakeshi, Inner Mongolia. During the event, Changan formally unveiled its global sodium-ion battery strategy and announced the commencement of its 2026 Global Testing Season. Changan is accelerating the advancement of sodium-ion battery technology as part of its global battery strategy. Tan Benhong, Chief Brand Officer of China Ch...
-
Changan lance la Saison Mondiale d’Essais 2026 avec une mise à jour de l’intelligence SDA et une stratégie sur les batteries sodium-ion
YAKESHI, Chine--(BUSINESS WIRE)--Changan Automobile a organisé un événement à Yakeshi, en Mongolie-Intérieure, autour du thème « Mise à jour de l’intelligence SDA & Lancement mondial de la stratégie des batteries sodium-ion ». À cette occasion, le constructeur a officiellement dévoilé sa stratégie mondiale en matière de batteries sodium-ion et annoncé le lancement de sa Saison Mondiale d’Essais 2026. Dans le cadre de sa stratégie globale sur les batteries, Changan accélère le développement...