Newsroom
Sorted by: Latest
-
Qube Research & Technologies LTD UK Regulatory Announcement: Form 8.3
LONDON--(BUSINESS WIRE)-- FORM 8.3 PUBLIC OPENING POSITION DISCLOSURE/DEALING DISCLOSURE BY A PERSON WITH INTERESTS IN RELEVANT SECURITIES REPRESENTING 1% OR MORE Rule 8.3 of the Takeover Code (the “Code”) 1. KEY INFORMATION (a) Full name of discloser: Qube Research & Technologies Limited (b) Owner or controller of interests and short positions disclosed, if different from 1(a): The naming of nominee or vehicle companies is insufficient. For a trust, the trustee(s), settlor and beneficiari...
-
Newton Golf Sets Second Quarter 2026 Conference Call for Friday, August 14, 2026 at 5:00 p.m. ET
CAMARILLO, Calif.--(BUSINESS WIRE)--Newton Golf Company, Inc. (NASDAQ: NWTG), a technology-forward golf equipment company focused on physics-driven engineering, will hold a conference call on Friday, August 14, 2026 at 5:00 p.m. Eastern time to discuss results for the second quarter ended June 30, 2026. The financial results will be issued in a press release prior to the call.Newton Golf management will host the presentation, followed by a question-and-answer period.Date: Friday, August 14, 2026...
-
Powerlaw Capital Group, LLC Announces Public Filing for Second Fund
SAN FRANCISCO--(BUSINESS WIRE)--Powerlaw Capital Group, LLC, an asset management platform focused on expanding access to private technology investing through publicly traded investment vehicles, today announced it has publicly filed a registration statement on Form N-2 with the U.S. Securities and Exchange Commission (“SEC”) in connection with the proposed launch of its second registered fund. The filing follows the successful May 27th, 2026, direct listing of Powerlaw Corp. (Nasdaq: PWRL), a cl...
-
Paysafe to Release Second Quarter 2026 Earnings Results on August 13, 2026
LONDON--(BUSINESS WIRE)--Paysafe Limited (NYSE: PSFE), a global payments platform, will announce second quarter 2026 financial results on Thursday, August 13, 2026, before market open. Management will host a live webcast to discuss the results at 8:30a.m. ET the same day. The webcast, along with supplemental information, can be accessed on the investor relations section of the Paysafe website at ir.paysafe.com. An archive will be available after the conclusion of the event and will remain avail...
-
PropertyRadar Powers Multi-Channel Marketing Across 160 Million Properties Using Nylas Email API
SAN FRANCISCO--(BUSINESS WIRE)--Nylas, the communications data layer for modern software, recently published a case study detailing how PropertyRadar built the email backbone for its multi-channel marketing engine using the Nylas Email API. PropertyRadar is the property intelligence and outreach platform used by real estate investors, agents, brokers, and marketing agencies to find, contact, and close deals with property owners across the United States. The platform covers more than 160 million...
-
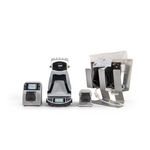
Thermo Fisher Scientific Launches Thermo Scientific™ InstaFlux™ to Help Food Microbiology Labs Simplify Workflows in Pathogen and Environmental Testing
WALTHAM, Mass.--(BUSINESS WIRE)--Thermo Fisher Scientific today announced the global launch of Thermo Scientific™ InstaFlux™, an integrated media-on-demand enrichment workflow that helps food microbiology laboratories simplify media preparation, improve productivity and enhance sample traceability. Food testing laboratories face growing pressure to process more samples, meet turnaround expectations and maintain consistent quality while managing staffing constraints, sustainability goals and inc...