Newsroom
Sorted by: Latest
-
EquipmentShare.com Inc. Sued for Securities Law Violations - Contact the DJS Law Group to Discuss Your Rights – EQPT
LOS ANGELES--(BUSINESS WIRE)--EquipmentShare.com Inc. Sued for Securities Law Violations - Contact the DJS Law Group to Discuss Your Rights – EQPT...
-
Photos of the Nintendo Experiences at San Diego Comic-Con are Available on Business Wire’s Website
SAN DIEGO--(BUSINESS WIRE)--Photos of the Nintendo Experiences at San Diego Comic-Con are Available on Business Wire’s Website...

-
Cogent Communications Holdings, Inc. Sued for Securities Law Violations - Contact the DJS Law Group to Discuss Your Rights – CCOI
LOS ANGELES--(BUSINESS WIRE)--Cogent Communications Holdings, Inc. Sued for Securities Law Violations - Contact the DJS Law Group to Discuss Your Rights – CCOI...
-
Kuwait Oil Company Signs US$ 16.0 Billion Infrastructure Partnership Involving Its Crude Oil Pipeline Network With a Consortium Comprising Blackstone, Brookfield and KKR
KUWAIT CITY, Kuwait--(BUSINESS WIRE)--Kuwait Petroleum Corporation ("KPC"), the state-owned corporation overseeing Kuwait's oil and gas sector, today announced that its wholly owned subsidiary, Kuwait Oil Company (“KOC”), responsible for the exploration, production and transportation of crude oil on behalf of the State of Kuwait, has signed a US$ 16.0 billion lease-and-lease-back agreement involving its entire domestic and export pipeline network with a consortium of international infrastructur...

-
Wix.com Ltd. (NASDAQ: WIX) Investors Who Suffered Losses May Be Eligible to Participate in the Securities Class Action; Contact Robbins LLP for Information About Recovering Your Losses
SAN DIEGO--(BUSINESS WIRE)--Robbins LLP is investigating whether Wix misled investors regarding the competitiveness and performance of its AI offerings....

-
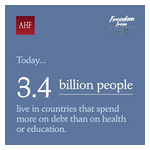
AHFتدعم مساعي إصلاح ديون الاتحاد الأفريقي
كمبالا، أوغندا--(BUSINESS WIRE)--رحّبت AIDS Healthcare Foundation (AHF) بتركيز الاتحاد الأفريقي على استدامة الديون في جلسة اللجان الفنية المتخصصة التي عُقدت هذا الأسبوع في أبيدجان، بكوت ديفوار، بينما حثت القادة الأفارقة على مواصلة الضغط من أجل إجراء إصلاحات هيكلية لنظام الديون العالمي الذي يمنع البلدان النامية من الاستثمار في الرعاية الصحية والتعليم وغير ذلك من الاحتياجات البشرية الأساسية. وتستند محادثات أبيدجان إلى الموقف الأفريقي المشترك بشأن الديون الذي اعتمده رؤساء الدول الأفريقية في فبراير....
-
Otsuka Receives FDA Approval for First-in-Class SIMTRIYO® (centanafadine) for the Treatment of Attention-Deficit Hyperactivity Disorder (ADHD) in Adults and Pediatric Patients Aged 6 Years and Older
PRINCETON, N.J. & TOKYO--(BUSINESS WIRE)--Otsuka Pharmaceutical Development & Commercialization, Inc. and Otsuka Pharmaceutical Co., Ltd. (Otsuka) today announced that the U.S. Food and Drug Administration (FDA) has granted approval of SIMTRIYO® (centanafadine), a once-daily extended-release capsule for the treatment of attention-deficit hyperactivity disorder (ADHD) in adults and pediatric patients aged 6 years and older weighing at least 20kg. As the first and only approved norepinephrine...
-
AHF soutient l’initiative de l’Union africaine en faveur d’une réforme de la dette
KAMPALA, Ouganda--(BUSINESS WIRE)--AIDS Healthcare Foundation (AHF) a salué l’accent mis par l’Union africaine sur la viabilité de la dette lors de la session des comités techniques spécialisés qui s’est tenue cette semaine à Abidjan, en Côte d’Ivoire, tout en exhortant les dirigeants africains à continuer de militer en faveur de réformes structurelles du système mondial de la dette, qui empêche les pays en développement d’investir dans la santé, l’éducation et d’autres besoins humains fondamen...

-
Hertz Global Holdings, Inc. (NASDAQ: HTZ) Investors Who Suffered Losses May Be Eligible to Participate in Securities Class Action; Contact Robbins LLP for Information About Recovering Your Losses
SAN DIEGO--(BUSINESS WIRE)--Robbins LLP informs investors that a securities class action has been filed on behalf of all persons who purchased or otherwise acquired Hertz Global Holdings, Inc. (NASDAQ: HTZ) common stock between February 28, 2024 and February 25, 2026, inclusive (the "Class Period").Investors who suffered significant losses during the Class Period may be eligible to participate in the lawsuit and should contact Robbins LLP for information about becoming lead plaintiff.Why Was Her...

-
PROCEPT BioRobotics Corporation (NASDAQ: PRCT) Investors Who Suffered Losses May Be Eligible to Participate in Securities Class Action; Contact Robbins LLP for Information About Recovering Your Losses
SAN DIEGO--(BUSINESS WIRE)--Robbins LLP informs investors that a securities class action has been filed on behalf of all purchasers of PROCEPT BioRobotics Corporation (NASDAQ: PRCT) common stock between February 28, 2024 and February 25, 2026, inclusive (the "Class Period").Investors who suffered significant losses during the Class Period may be eligible to participate in the lawsuit and should contact Robbins LLP for information about becoming lead plaintiff.Why Was PROCEPT Sued?The complaint a...