Newsroom
Sorted by: Latest
-
KiddeFenwal startet neue Website und Informationsplattform
ASHLAND, Mass.--(BUSINESS WIRE)--KiddeFenwal, der weltweit führende Anbieter in der Brandbekämpfungs- und Sicherheitssteuerungsbranche, hat heute eine neu gestaltete Website vorgestellt, die als umfassende Informationsplattform für Fachleute und Kunden der Brandschutzbranche dienen soll. Die modernisierte Plattform umfasst Funktionen, die speziell für die globalen Partner, OEMs und Vertriebspartner des Unternehmens entwickelt wurden, darunter: eine optimierte Navigation durch das Produktportfol...
-
KiddeFenwal lance un nouveau site web et un centre d'information
ASHLAND, Massachusetts--(BUSINESS WIRE)--KiddeFenwal, leader mondial de lutte contre l'incendie et des contrôles de sécurité, a dévoilé aujourd'hui une refonte de son site web, conçu comme une plateforme d'information complète destinée aux professionnels comme aux clients du secteur de la sécurité incendie. Cette plateforme modernisée intègre des fonctionnalités spécialement conçues pour les partenaires, équipementiers et distributeurs internationaux de l'entreprise, notamment : Navigation accé...
-
NIPPON KINZOKU Accelerates Global Sales of Ultra-Thin Electrical Steel Strips "GT Series" and "ST Series" as "Fine Eco Metal" Environmentally Friendly Products
TOKYO--(BUSINESS WIRE)--NIPPON KINZOKU CO., LTD. (Headquarters: Minato-ku, Tokyo; President: Yasushi Shimokawa; TOKYO: 5491) and its subsidiary, NIKKIN DENJI KOGYO CO., LTD. (Headquarters: Kawaguchi, Saitama; President: Akira Nishimura), are launching a strategic sales initiative for their ultra-thin Grain-Oriented (GT Series) and Non-Oriented (ST Series) electrical steel strips under the brand name "Fine Eco Metal". "Fine Eco Metal" is a brand name for our proprietary "Eco-Product" series, cer...

-
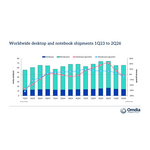
Omdia: Worldwide PC Market Declined 4% in 2Q26 Amid Mounting Supply Pressure
LONDON--(BUSINESS WIRE)--Global shipments of desktops, notebooks, and workstations in 2Q26 declined 3.6% year-over-year to 65.7 million units according to the latest research from Omdia. Shipments of desktops (including desktop workstations) hit 13.9 million, falling 1.3% annually, while notebook (including mobile workstations) shipments landed at 51.7 million units, representing a 4.2% decline. “The sharp increase in memory and storage prices during the first quarter of the year had a signific...
-
ROYC and PwC Sweden Collaborate to Digitalize Private Equity Structuring & Fund Operations
STOCKHOLM--(BUSINESS WIRE)--ROYC today announces a strategic collaboration with PwC Sweden to accelerate the digitalization of the GP value chain. The partnership brings together PwC Sweden's market-leading expertise in fund formation and structuring with ROYC’s platform capabilities, with the shared aim of compressing time-to-market, eliminating manual friction in early-phase workflows, and improving the client experience across the full fund lifecycle for fund managers operating across any ju...
-
Bitdefender Launches Sovereign Acceleration Program to Advance European Data Sovereignty Initiatives
BUCHAREST, Romania--(BUSINESS WIRE)--Bitdefender announced the launch of its Sovereign Acceleration Program for European organizations....
-
3E Acquires Yordas Group: Expanding Leadership in Product Compliance by Augmenting 3E’s Global Regulatory Content and Expertise, and Adding REACH Registration Services
CARLSBAD, Calif.--(BUSINESS WIRE)--3E, the leading global provider of expert-led AI compliance solutions for chemical and workplace safety, product stewardship, and sustainable supply chains, today announced its acquisition of Yordas Group, a leading international provider of scientific consulting and regulatory content services across chemical management, product stewardship, sustainability, and regulatory compliance. Headquartered in Lancaster, UK, with operations in Germany, Canada, Türkiye,...
-
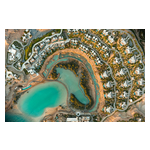
Red Sea Global開設Six Senses AMAALA,進一步強化AMAALA健康養生服務
沙烏地阿拉伯利雅德--(BUSINESS WIRE)--(美國商業資訊)-- 再生旅遊開發商Red Sea Global (RSG)宣佈海濱度假村Six Senses AMAALA正式開業,並將於7月中旬迎來首批賓客。 此次開幕標誌著AMAALA目的地發展歷程中令人興奮的新篇章。隨著該項目持續展現生機並迎來首批賓客,在聳立的海濱峭壁、受保護的海灣、原生態海灘以及山巒起伏的沙漠美景襯托下,盡情享受無與倫比的健康養生體驗。 Red Sea Global集團行政總裁John Pagano表示:「我們納入投資組合的每一家合作夥伴都經過精挑細選,因為他們與我們擁有相同的長遠願景,即打造以人類與地球再生為核心的奢華旅遊。Six Senses憑藉植根於自然、可持續發展及在地文化的健康養生體驗而享譽全球,這使其成為AMAALA的完美契合之選。作為我們投資組合中的第二家Six Senses度假村,此次合作體現了我們致力於打造基於品質與關懷的款待服務之承諾,從而豐富沙烏地阿拉伯的旅遊業。」 Six Senses AMAALA標誌著RSG與該品牌的第二度合作,此前雙方已於2023年開設了Six Senses...

-
Alchemab Therapeutics Announces Largest Ever Life Sciences Investment From British Business Bank to Advance AI-Enabled Clinical Pipeline of Next Generation Human-Derived Antibodies
CAMBRIDGE, England--(BUSINESS WIRE)--Alchemab Therapeutics has secured £25m/$34m from the British Business Bank – the Bank’s largest investment in a life sciences company to date....
-
Red Sea Global 开业 Six Senses AMAALA,进一步丰富 AMAALA 健康养生体验
沙特阿拉伯利雅得--(BUSINESS WIRE)--(美国商业资讯)-- 作为再生旅游开发商,Red Sea Global(RSG)今日宣布,海滨度假酒店 Six Senses AMAALA 正式开业,并将于 7 月中旬迎来首批宾客。 此次开业标志着 AMAALA 目的地发展进程中的又一重要里程碑。随着这一目的地不断完善并陆续迎接宾客,AMAALA 将在巍峨海岸峭壁、静谧天然海湾、纯净原始沙滩和壮阔山地沙漠景观的映衬下,为全球宾客呈献无与伦比的健康养生体验。 Red Sea Global 集团首席执行官 John Pagano 表示:“我们选择每一位合作伙伴加入我们的项目组合,都是因为彼此秉持一致的长期愿景——打造以人与地球再生为核心的奢华旅行体验。Six Senses 凭借植根于自然、可持续发展理念和在地文化的健康养生体验,在全球享有盛誉,与 AMAALA 的定位可谓相得益彰。作为我们项目组合中的第二家六善度假酒店,此次合作彰显了我们致力于打造以卓越品质与悉心服务为核心的高端酒店产品的坚定承诺,也将进一步丰富沙特阿拉伯的旅游产品供给,助力其旅游业高质量发展。” Six Senses...