
")
")
")
NEW YORK--(BUSINESS WIRE)--Spotify Technology S.A. (NYSE:SPOT) today reported financial results for the first fiscal quarter of 2018 ending March 31, 2018.
Dear Shareholders,
Today Spotify is reporting results for the first fiscal quarter of 2018 ending March 31, 2018.
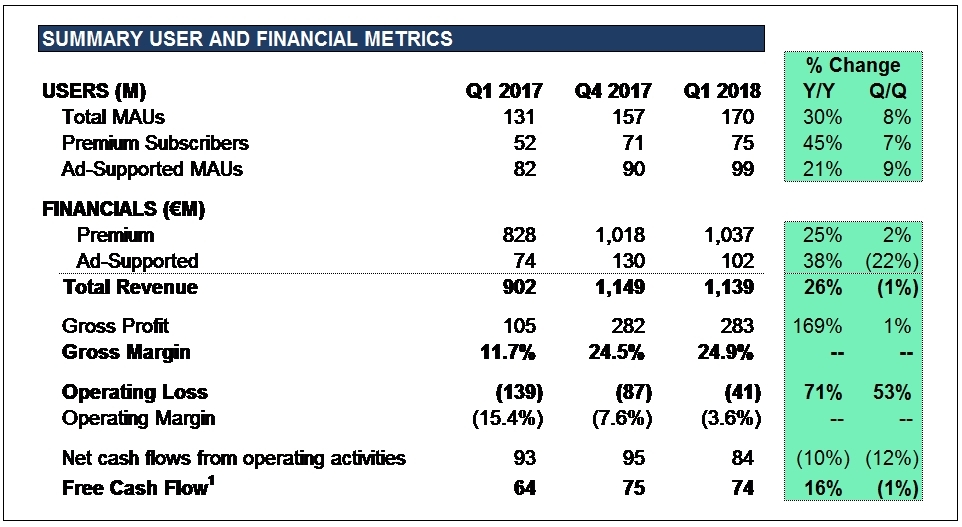
We finished the quarter with 170 million Monthly Active Users (“MAU”) and 75 million Premium Subscribers, up 30% and 45%, respectively, Y/Y.
Total Revenue was €1,139 million growing 26% Y/Y, and 37% Y/Y after adjusting for the negative impact from changes in foreign exchange rates1.
Gross Margin was 24.9% in Q1, above the high end of our guidance range of 23-24%. Excluding adjustments to prior period estimates primarily related to changes in rights holder liabilities booked in the quarter, we would have finished at the high end of our stated range. These adjustments accounted for approximately 124 basis points of Gross Margin in Q1.
Our Operating Loss was €41 million or approximately 4% of Total Revenue. This was also better than our guidance for the quarter, but was largely due to the flow through from the Gross Profit outperformance mentioned above. Operating expenses were in line with our expectations. Net cash flows from operating activities were €84 million, and Free Cash Flow was €74 million1.
| ____________________ |
|
1 Free Cash Flow and Revenue excluding foreign exchange effect are non-IFRS measures. See “Use of Non-IFRS Measures” and “Reconciliation of IFRS to Non-IFRS Results” for additional information. |
FIRST QUARTER HIGHLIGHTS & RECENT DEVELOPMENTS
Direct Listing
On April 3, the ordinary shares of Spotify were listed for trading on the New York Stock Exchange. This is our first interim report as a public company. Investor information can be found on our IR website (investors.spotify.com).
Personalized Discovery: All-New Free Tier
On April 24, we officially unveiled a new Ad-Supported experience on Spotify. The updated user experience provides greater consumer control and an increased focus on curation and personalization. Ad-Supported users can now listen to any track in their top 15 Spotify curated playlists completely on-demand. Each user’s on-demand experience will be completely based on their individual music consumption and preferences they list upon sign up. Additionally, we introduced Data Saver, a simple optimization switch users can activate so that less mobile data is used while streaming music.
Expanding Hulu Bundle
Following the success of the Hulu/Spotify Premium for Student bundle which launched in September 2017, we expanded that program in early April 2018 to offer a similar deal to our Standard Plan subscribers. Existing subscribers are eligible to upgrade to the $12.99 per month plan today, and the plan will be made available to new subscribers later this summer.
New Market Launches
On March 13, we launched service in four new markets: Israel, Romania, South Africa, and Vietnam. This brought our total footprint to 65 countries and territories, and marked our first entry into the African continent.
Cadillac Partnership
At the end of March, we announced an integration with Cadillac to provide drivers with a seamless listening experience akin to using the radio from the moment they enter their car. The vehicle connects to Spotify itself using a 4G LTE connection without the need to use your phone, cables, or a Bluetooth connection. All of the artists, albums, and personalized playlists you love are integrated into the car’s infotainment system—you can even make Spotify playlists into presets the same way you would an FM radio station. Plus, the app is designed to deliver personalized recommendations specifically geared toward the drive.
Podcasts
During Q1 we entered into partnerships with several major podcast networks and aggregators which more than doubled the size of our catalog compared to Q4 2017. Consumption hours are rapidly increasing, and we plan to continue our investment into podcasts and other forms of spoken word content.
Growth of Global Recorded Music Market Accelerates
The International Federation of the Phonographic Industry (“IFPI”) released its annual Global Music Report on April 24. IFPI reported that the global recorded music market was worth $17.3 billion in 2017, up 8.1% on 2016 marking the third consecutive year of growth for the industry. Much of that growth was again led by streaming where revenues grew 41.1% to $6.6 billion and now account for 38.4% of all recorded music revenue - the single biggest revenue source. Other key takeaways: paid subscription audio streams grew 45.5%, and there are now more than 176 million people paying for music subscriptions globally.
GRAMMY Best New Artist Party
This January, Spotify aligned with GRAMMY week to celebrate the second annual Best New Artist Party in New York City. All 5 featured nominees (Alessia Cara, Khalid, Julia Michaels, Lil Uzi Vert, and SZA) have been true partners to Spotify and have enjoyed growth and success in part attributable to the support we’ve provided both on and off the platform. In addition to the party, we also executed a large out-of-home campaign honoring the five nominees.
USER METRICS
We closed the quarter with 170 million monthly active users (up 30% Y/Y). Both Ad-Supported and Premium MAU were in line with our expectations and guidance range.
Ad-Supported MAUs totaled 99 million at the end of Q1, up 21% Y/Y and 9% Q/Q. We continue to see strong growth in emerging markets, particularly Asia given our recent launches in Vietnam and Thailand, as well as increasing momentum in Japan.
Premium Subscribers grew to 75 million, up 45% Y/Y. Family Plan additions continued to be a source of strength. We also extended the length of our trial programs from 30 days to 60 days in certain key markets including the US, Australia, and Brazil, which we believe will have a positive effect on conversion and smooth some of the seasonal intake trends over time.
Premium Churn was on trend in the quarter thanks to the continued popularity of the high retention Family and Student plans. While we don’t plan to disclose Premium Churn on an ongoing basis, our average monthly Premium Churn rate for the quarter fell below 5%, a significant milestone. Greater penetration of our high retention products and a general maturation of our overall subscriber base should have a long-term downward impact on Premium Churn, mitigated somewhat by launches in new markets.
FINANCIAL METRICS
Revenue
Total revenue was €1,139 million this quarter, increasing 26% Y/Y. Foreign exchange rate movement was a significant headwind this quarter. Excluding the negative impact from foreign exchange rates, growth in revenue would have been 37% Y/Y.
Premium revenue was €1,037 million in Q1, up 25% Y/Y. Foreign exchange rates had a meaningful impact as Premium revenue would have been up 36% Y/Y if the negative impact were excluded. Average revenue per user (“ARPU”) was €4.72 in Q1, down 14% Y/Y. Growth in Family and Student plans continues to weigh on ARPU, as does the shift in market mix as we grow faster in relatively lower ARPU geographies, like Latin America, and launch new markets. Changes in foreign exchange rates also contributed to the decline in ARPU. Excluding the impact of foreign exchange rates, ARPU would have been down 6% Y/Y.
Ad-Supported revenue was €102 million in Q1, up 38% Y/Y. Foreign exchange rates also had a substantial impact on advertising revenues due to the mix of US dollar denominated revenue. Adjusting for the impact of foreign exchange rates, Ad-Supported revenue would have grown 55% Y/Y.
The majority of our Ad-Supported revenue continues to be driven through our Direct channel, but growth in Programmatic continues to outperform our expectations nearly doubling Y/Y.
Ad spending continues to grow faster on our mobile platform, which comprises a majority of ad revenue. From a product perspective, video is our fastest growing source of revenue, while audio remains our largest source of revenue and continues to experience solid growth.
We launched a beta version of our self-serve advertising platform (Ad Studio) late last year. Hundreds of advertisers have successfully launched campaigns through the platform, and thousands more have signed up requesting access. While still small, early results have been encouraging, and we expect self-serve to become a significant portion of Ad-Supported revenue.
Gross Margin
Gross margin was 24.9% in Q1, up from 24.5% in Q4 and 11.7% in Q1 2017. We outperformed the high end of our guidance range primarily due to changes in prior period estimates for rights holder liabilities. These adjustments accounted for a gain of 124 bps in the quarter. We typically see a seasonal decline in gross margins of our business in Q1 and Q3 resulting from the costs of promotional campaigns we launch in Q2 and Q4 of each calendar year during which we typically experience fast subscriber growth. We expect Gross Margin to normalize to historical seasonal patterns for the remainder of the year.
Operating Expenses / Income (Loss)
Operating expenses totaled €324 million this quarter. As a percentage of revenue, operating expenses fell 140 bps year over year.
Total Operating Loss was €41 million. Operating Margin of 3.6% was an improvement of 1,180 bps Y/Y and 400 bps Q/Q.
As of March 31, we had 3,813 full-time employees and contractors globally. Research & Development made up the greatest share of hiring this quarter, accounting for almost half of the added headcount.
Free Cash Flow
We generated €84 million in Net cash flows from operating activities, and €74 million in Free Cash Flow in the first quarter. As we spoke about at our Investor Day on March 15, we have positive working capital dynamics, and our goal is to sustain and grow Free Cash Flow into the near future excluding the impact of capital expenditures associated with the build out of new and existing offices in New York, London, Los Angeles, Stockholm, and Boston among others.
At the end of the quarter, we held €1.6 billion in cash and cash equivalents, restricted cash, and short-term investments.
OUTLOOK
These forward-looking statements reflect Spotify’s expectations as of May 2, 2018 and are subject to substantial uncertainty. For the second quarter, we are expecting:
- Total Monthly Active Users (“MAU”): 175-180 million, up 28-32% Y/Y
- Total Premium Subscribers: 79-83 million, up 34-41% Y/Y
- Total Revenue: €1.1-€1.3 billion, up 10-29% Y/Y. This includes a negative impact of approximately €95 million from foreign exchange rates; excluding this impact, up 20-38% Y/Y
- Gross Margin: 24-26%
- Operating loss: €60-€140 million. This includes expenses related to the direct listing of €30-€35 million
Our expectations for the Full Year 2018 are unchanged. They are:
- Total Monthly Active Users (“MAU”): 198-208 million, up 26-32% Y/Y
- Total Premium Subscribers: 92-96 million, up 30-36% Y/Y
- Total Revenue: €4.9-€5.3 billion, up 20-30% Y/Y. This includes a negative impact of approximately €280 million from foreign exchange rates; excluding this impact, up 26-37% Y/Y
- Gross Margin: 23-25%
- Operating loss: €230-€330 million
EARNINGS QUESTION & ANSWER SESSION
The Company will be hosting a live question and answer session starting at 5 p.m. ET today on investors.spotify.com. Daniel Ek, our Co-Founder and CEO, and Barry McCarthy, our Chief Financial Officer, will be on hand to answer questions submitted to ir@spotify.com and through the live chat window available through the webcast. Participants may also join using the following listen-only conference line:
Participant Toll Free Dial-In Number: (866) 393-4306
Participant
International Dial-In Number: (734) 385-2616
Conference ID 6066125
Use of Non IFRS Measures
This shareholder letter includes references to the non-IFRS financial measures of EBITDA and Free Cash Flow. Management believes that EBITDA and Free Cash Flow are important metrics because they present measures that approximate the amount of cash generated that is available to repay debt obligations, make investments, and for certain other activities that exclude certain infrequently occurring and/or non-cash items. However, these measures should be considered in addition to, not as a substitute for or superior to, net income, operating income, or other financial measures prepared in accordance with IFRS. This shareholder letter also includes references to the non-IFRS financial measures of Revenue excluding foreign exchange effect, Premium revenue excluding foreign exchange effect and Ad-Supported revenue excluding foreign exchange effect. Management believes that Revenue excluding foreign exchange effect, Premium revenue excluding foreign exchange effect and Ad-Supported revenue excluding foreign exchange effect are important metrics because they present measures that facilitate comparison to our historical performance. Revenue excluding foreign exchange effect, Premium revenue excluding foreign exchange effect and Ad-Supported revenue excluding foreign exchange effect excluding foreign exchange effect should be considered in addition to, not as a substitute for or superior to, Revenue, Premium revenue, Ad-Supported revenue or other financial measures prepared in accordance with IFRS.
Forward Looking Statements
We would like to caution you that this letter to shareholders contains “forward-looking statements” as defined in Section 27A of the United States Securities Act of 1933, as amended, and Section 21E of the United States Securities Exchange Act of 1934, as amended. We intend such forward-looking statements to be covered by the safe harbor provisions for forward-looking statements contained in the Private Securities Litigation Reform Act of 1995 and include this statement for purposes of complying with the safe harbor provisions. Such forward-looking statements involve significant risks, uncertainties and assumptions that could cause actual results to differ materially from our historical experience and our present expectations or projections, including but not limited to the following known material factors: our ability to attract prospective customers and to retain existing customers; our dependence upon third-party licenses for sound recordings and musical compositions; our ability to comply with the many complex license agreements to which we are a party; our ability to generate sufficient revenue to be profitable or to generate positive cash flow on a sustained basis; our lack of control over the providers of our content and their effect on our access to music and other content; our ability to accurately estimate the amounts payable under our license agreements; the limitations on our operating flexibility due to the minimum guarantees required under certain of our license agreements; our ability to obtain accurate and comprehensive information about music compositions in order to obtain necessary licenses or perform obligations under our existing license agreements; potential breaches of our security systems; risk associated with unauthorized access of our software and services and manipulation of stream counts and customer accounts; assertions by third parties of infringement or other violations by us of their intellectual property rights; risk associated with our substantial indebtedness; risks related to our status as a foreign private issuer; dilution resulting from additional share issuances; and the concentration of voting power among our founders who have and will continue to have substantial control over our business; tax-related risks; unanticipated changes relating to competitive factors in our industry; ability to hire and retain key personnel; changes in legislation or governmental regulations affecting us; international, national or local economic, social or political conditions; conditions in the credit markets; risks associated with accounting estimates, currency fluctuations and foreign exchange controls; and such other risks as set forth in our filings with the United States Securities and Exchange Commission.
We caution you not to place undue reliance on these forward-looking statements, which speak only as of the date hereof. We undertake no obligation to publicly update or revise any of our forward-looking statements after the date they are made, whether as a result of new information, future events or otherwise, except to the extent required by law.
| Interim condensed consolidated statement of operations | ||||||||||||
|
(Unaudited) |
||||||||||||
|
(in € millions, except share and per share data) |
||||||||||||
| Three months ended | ||||||||||||
| March 31, | December 31, | March 31, | ||||||||||
| 2018 | 2017 | 2017 | ||||||||||
| Revenue | 1,139 | 1,149 | 902 | |||||||||
| Cost of revenue | 856 | 867 | 797 | |||||||||
| Gross profit | 283 | 282 | 105 | |||||||||
| Research and development | 115 | 123 | 80 | |||||||||
| Sales and marketing | 138 | 173 | 110 | |||||||||
| General and administrative | 71 | 73 | 54 | |||||||||
| 324 | 369 | 244 | ||||||||||
| Operating loss | (41 | ) | (87 | ) | (139 | ) | ||||||
| Finance income | 15 | 36 | 27 | |||||||||
| Finance costs | (154 | ) | (545 | ) | (62 | ) | ||||||
| Share in earnings of associate | — | — | 2 | |||||||||
| Finance income/(costs) - net | (139 | ) | (509 | ) | (33 | ) | ||||||
| Loss before tax | (180 | ) | (596 | ) | (172 | ) | ||||||
| Income tax (benefit) expense | (11 | ) | — | 1 | ||||||||
| Net loss attributable to owners of the parent | (169 | ) | (596 | ) | (173 | ) | ||||||
| Net loss per share attributable to owners of the parent | ||||||||||||
| Basic and diluted | (1.01 | ) | (3.87 | ) | (1.15 | ) | ||||||
| Weighted-average ordinary shares outstanding | ||||||||||||
| Basic and diluted | 167,778,952 | 154,126,524 | 150,149,327 | |||||||||
| Interim condensed consolidated statement of financial position | ||||||||
|
(in € millions) |
||||||||
| March 31, | December 31, | |||||||
| 2018 | 2017 | |||||||
| (Unaudited) | ||||||||
| Assets | ||||||||
| Non-current assets | ||||||||
| Property and equipment | 68 | 73 | ||||||
| Intangible assets including goodwill | 161 | 162 | ||||||
| Investment in associate | 1 | 1 | ||||||
| Long term investments | 968 | 910 | ||||||
| Restricted cash | 56 | 54 | ||||||
| Deferred tax assets | 10 | 9 | ||||||
| 1,264 | 1,209 | |||||||
| Current assets | ||||||||
| Trade and other receivables | 322 | 360 | ||||||
| Income tax receivable | 1 | — | ||||||
| Short term investments | 843 | 1,032 | ||||||
| Cash and cash equivalents | 733 | 477 | ||||||
| Other current assets | 39 | 29 | ||||||
| 1,938 | 1,898 | |||||||
| Total assets | 3,202 | 3,107 | ||||||
| Equity and liabilities | ||||||||
| Equity | ||||||||
| Share capital | — | — | ||||||
| Other paid in capital | 2,531 | 2,488 | ||||||
| Other reserves | 226 | 177 | ||||||
| Accumulated deficit | (2,596 | ) | (2,427 | ) | ||||
| Equity attributable to owners of parent | 161 | 238 | ||||||
| Non-current liabilities | ||||||||
| Convertible notes | 1,022 | 944 | ||||||
| Accrued expenses and other liabilities | 61 | 56 | ||||||
| Provisions | 7 | 6 | ||||||
| Deferred tax liabilities | 3 | 3 | ||||||
| 1,093 | 1,009 | |||||||
| Current liabilities | ||||||||
| Trade and other payables | 360 | 341 | ||||||
| Income tax payable | 4 | 9 | ||||||
| Deferred revenue | 223 | 216 | ||||||
| Accrued expenses and other liabilities | 889 | 881 | ||||||
| Provisions | 53 | 59 | ||||||
| Derivative liabilities | 419 | 354 | ||||||
| 1,948 | 1,860 | |||||||
| Total liabilities | 3,041 | 2,869 | ||||||
| Total equity and liabilities | 3,202 | 3,107 | ||||||
| Interim condensed consolidated statement of cash flows | |||||||||||||
|
(Unaudited) |
|||||||||||||
|
(in € millions) |
|||||||||||||
| Three months ended | |||||||||||||
| March 31, | December 31, | March 31, | |||||||||||
| 2018 | 2017 | 2017 | |||||||||||
| Operating activities | |||||||||||||
| Net loss | (169 | ) | (596 | ) | (173 | ) | |||||||
| Adjustments to reconcile net loss to net cash flows | |||||||||||||
| Depreciation of property and equipment | 9 | 11 | 12 | ||||||||||
| Amortization of intangible assets | 2 | 2 | 2 | ||||||||||
| Share-based payments expense | 18 | 14 | 14 | ||||||||||
| Impairment loss on trade receivables | 3 | (1 | ) | — | |||||||||
| (Gain)/loss on disposal of equipment | (1 | ) | 1 | — | |||||||||
| Finance income | (15 | ) | (36 | ) | (27 | ) | |||||||
| Finance costs | 154 | 545 | 62 | ||||||||||
| Income tax (benefit) expense | (11 | ) | — | 1 | |||||||||
| Share in earnings of associate | — | — | (2 | ) | |||||||||
| Net foreign exchange gains | (1 | ) | (4 | ) | — | ||||||||
| Changes in working capital: | |||||||||||||
| Decrease/(increase) in trade receivables and other assets | 15 | (46 | ) | (40 | ) | ||||||||
| Increase in trade and other liabilities | 70 | 195 | 186 | ||||||||||
| Increase in deferred revenue | 9 | 43 | 9 | ||||||||||
| (Decrease)/increase in provisions | (3 | ) | (39 | ) | 44 | ||||||||
| Interest received | 10 | 6 | 5 | ||||||||||
| Net income tax paid | (6 | ) | — | — | |||||||||
| Net cash flows from operating activities | 84 | 95 | 93 | ||||||||||
| Investing activities | |||||||||||||
| Business combinations, net of cash acquired | — | (11 | ) | (23 | ) | ||||||||
| Purchases of property and equipment | (6 | ) | (21 | ) | (1 | ) | |||||||
| Proceeds from sales of equipment | 1 | — | — | ||||||||||
| Purchases of intangibles | (2 | ) | (3 | ) | (2 | ) | |||||||
| Purchases of short term investments | (271 | ) | (482 | ) | (357 | ) | |||||||
| Sales and maturities of short term investments | 430 | 237 | 286 | ||||||||||
| Transaction fees for long term investment | (9 | ) | — | — | |||||||||
| Change in restricted cash | (4 | ) | 1 | (28 | ) | ||||||||
| Net cash flows used in investing activities | 139 | (279 | ) | (125 | ) | ||||||||
| Financing activities | |||||||||||||
| Finance lease payments | — | — | (1 | ) | |||||||||
| Proceeds from issuance of ordinary shares | 4 | — | — | ||||||||||
| Proceeds from exercise of share options | 39 | 7 | 17 | ||||||||||
| Net cash flow from financing activities | 43 | 7 | 16 | ||||||||||
| Net increase/(decrease) in cash and cash equivalents | 266 | (177 | ) | (16 | ) | ||||||||
| Cash and cash equivalents at beginning of the period | 477 | 668 | 755 | ||||||||||
| Net exchange losses on cash and cash equivalents | (10 | ) | (14 | ) | (4 | ) | |||||||
| Cash and cash equivalents at December 31 | 733 | 477 | 735 | ||||||||||
| Reconciliation of IFRS to Non-IFRS Results | |||||||
|
(Unaudited) |
|||||||
|
(in € millions, except percentages) |
|||||||
| Three months ended | |||||||
| March 31, | March 31, | ||||||
| 2018 | 2017 | ||||||
| IFRS revenue | 1,139 | 902 | |||||
| Foreign exchange effect on 2018 revenue using 2017 rates | 100 | ||||||
| Revenue excluding foreign exchange effect - Ad-Supported | 1,239 | ||||||
| IFRS revenue year-over-year change % | 26 | % | |||||
| Revenue excluding foreign exchange effect year-over-year change % | 37 | % | |||||
| IFRS Premium revenue | 1,037 | 828 | |||||
| Foreign exchange effect on 2018 Premium revenue using 2017 rates | 87 | ||||||
| Premium revenue excluding foreign exchange effect | 1,124 | ||||||
| IFRS Premium revenue year-over-year change % | 25 | % | |||||
| Premium revenue excluding foreign exchange effect year-over-year change % | 36 | % | |||||
| IFRS Ad-Supported revenue | 102 | 74 | |||||
| Foreign exchange effect on 2018 Ad-Supported revenue using 2017 rates | 13 | ||||||
| Ad-Supported revenue excluding foreign exchange effect | 115 | ||||||
| IFRS Ad-Supported revenue year-over-year change % | 38 | % | |||||
| Ad-Supported revenue excluding foreign exchange effect year-over-year change % | 55 | % | |||||
| EBITDA | ||||||||||||
|
(Unaudited) |
||||||||||||
|
(in € millions) |
||||||||||||
| Three months ended | ||||||||||||
| March 31, | December 31, | March 31, | ||||||||||
| 2018 | 2017 | 2017 | ||||||||||
| Net loss attributable to owners of the parent | (169 | ) | (596 | ) | (173 | ) | ||||||
| Finance (income)/costs - net | 139 | 509 | 33 | |||||||||
| Income tax (benefit) expense | (11 | ) | — | 1 | ||||||||
| Depreciation and amortization | 11 | 13 | 14 | |||||||||
| EBITDA | (30 | ) | (74 | ) | (125 | ) | ||||||
| Free Cash Flow | ||||||||||||
|
(Unaudited) |
||||||||||||
|
(in € millions) |
||||||||||||
| Three months ended | ||||||||||||
| March 31, | December 31, | March 31, | ||||||||||
| 2018 | 2017 | 2017 | ||||||||||
| Net cash flows from operating activities | 84 | 95 | 93 | |||||||||
| Capital expenditures | (6 | ) | (21 | ) | (1 | ) | ||||||
| Change in restricted cash | (4 | ) | 1 | (28 | ) | |||||||
| Free Cash Flow | 74 | 75 | 64 | |||||||||