Newsroom
Sorted by: Latest
-
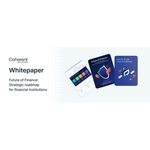
Coherent Solutions publie une étude sur la prévention de la fraude par l'IA dans le secteur bancaire et financier et sur les meilleurs modèles d'IA adaptés aux banques
MINNEAPOLIS--(BUSINESS WIRE)--Coherent Solutions a publié une étude sur l'avenir de la finance, illustrant comment l'IA fait progresser la détection des fraudes dans les services financiers. Cette étude offre aux institutions financières un cadre stratégique pour faire face à la montée en puissance de techniques de fraude plus sophistiquées grâce à des systèmes d'IA adaptatifs et interactifs, s'appuyant sur la vaste expérience de l'IA du cabinet d'ingénierie. Ce livre blanc aborde la menace mod...
-
Florida Structural Shell Contractor CSCI Ranked No. 6 on South Florida Business Journal’s 2026 Best Places to Work List
BOYNTON BEACH, Fla.--(BUSINESS WIRE)--CSCI honored as a South Florida Business Journal 2026 Best Places to Work, highlighting its employee-driven culture and leadership....

-
Niagen Bioscience to Present at the 38th Annual ROTH Conference
LOS ANGELES--(BUSINESS WIRE)--Niagen Bioscience, Inc. (NASDAQ: NAGE), the global authority on NAD+ (nicotinamide adenine dinucleotide) with a focus on the science of healthy aging, today announces that senior management will participate at the 38th Annual ROTH Conference, taking place at The Ritz-Carlton Laguna Niguel in Dana Point, California, from March 22 to 24, 2026. Niagen Bioscience CEO, Rob Fried, will participate in the Technologies Advancing Healthy Aging Panel on Monday, March 23, at...
-
Coherent Solutions publica un estudio sobre la prevención del fraude basada en la IA en el sector bancario y financiero, así como sobre los mejores modelos de IA para los bancos
MINNEAPOLIS--(BUSINESS WIRE)--Coherent Solutions ha publicado el estudio Future of Finance en el que se muestra cómo la IA está avanzando en la detección del fraude en los servicios financieros. El estudio ofrece a las instituciones financieras un marco estratégico para hacer frente a las técnicas de fraude cada vez más sofisticadas mediante sistemas de IA adaptativos que cuentan con la intervención humana, basándose en la amplia experiencia de la empresa en ingeniería de IA. Este informe técni...

-
Crossbow Therapeutics Raises $77 Million in Series B Financing to Advance Development of TCR-mimetic Antibody Therapies to Treat Cancer
CAMBRIDGE, Mass.--(BUSINESS WIRE)--Crossbow announced it raised $77 million in a Series B financing that will advance the development of TCR-mimetic antibody therapies to treat cancer....
-
viagogo Launches AI-Powered Tool for Artists, Teams, Venues
LONDON--(BUSINESS WIRE)--Today, viagogo announced the launch of viagogo Distribution Manager, an AI-powered self-serve tool that lets artists, teams and venues list and manage official tickets directly on its global marketplace. Distribution Manager is the first product built on top of viagogo's Open Distribution model, which the company has been scaling over the past 18 months. "Artists, teams and venues want to distribute on their own terms. Distribution Manager gives them a simple way to do...
-
StubHub Launches AI-Powered Tool for Artists, Teams, Venues
NEW YORK--(BUSINESS WIRE)--StubHub is announcing the launch of StubHub Distribution Manager, an AI-powered self-serve tool for artists, teams, and venues....
-
HSB Introduces AI Liability Insurance for Small Businesses
HARTFORD, Conn.--(BUSINESS WIRE)--HSB, part of Munich Re, introduces AI Liability Insurance coverage for small businesses....

-
QT Imaging to Hold 2025 Fourth Quarter and Full Year Conference Call on March 25, 2026
NOVATO, Calif.--(BUSINESS WIRE)--QT Imaging Holdings, Inc. (Nasdaq: QTI) (“QT Imaging” or the “Company”), a medical device company dedicated to transforming breast health management through innovative, radiation-free imaging technology, today announced that it will report financial results for the three and 12 months ended December 31, 2025 after market close on Wednesday, March 25, 2026 and will hold an investment community conference call that day beginning at 4:30 p.m. Eastern time. Date/Tim...
-
SEEQC Reports First Quantum Computer with Integrated Qubit Control on a Chip at Millikelvin Temperatures
ELMSFORD, N.Y.--(BUSINESS WIRE)--SEEQC today announced a significant breakthrough in the development of scalable, chip-based quantum computers, with results published in a peer-reviewed study in Nature Electronics. The publication reports the first demonstration of a full-stack quantum computing system with digital superconducting logic for qubit control operating reliably at millikelvin temperatures in the same cryogenic environment as quantum bits (qubits). The study details experimental resu...