

Newsroom
Sorted by: Latest
-
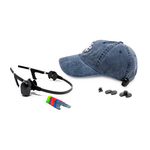
Oticon Medical Introduces Ponto™ Instant, Expanding Non-Surgical Choice with Instant HearBand and Instant SoundConnector
GOTHENBURG, Sweden--(BUSINESS WIRE)--Oticon Medical announces new non-surgical portfolio, Ponto Instant, designed to broaden access to bone conduction hearing...
-
Securonix and GRAMAX Cybertech Partner to Scale Managed Cyber Defense Across India's Critical and Regulated Industries
BANGALORE, India--(BUSINESS WIRE)--Securonix, Inc., today announced a strategic managed security services partnership with GRAMAX Cybertech Limited, to help enterprises across India strengthen cyber resilience with intelligence-driven, scalable, and compliance-ready security operations. Through the partnership, organizations across sectors will gain access to AI-powered detection, investigation, and response capabilities delivered through GRAMAX’s Integrated Cyber Defense Center and powered by...
-
Netcracker Brings Leadership in Telecom AI to CommsDay Summit 2026
WALTHAM, Mass.--(BUSINESS WIRE)--Netcracker will sponsor and participate in CommsDay Summit 2026, a leading telecom industry event in Sydney, Australia....
-
Mitsubishi Electric and Chiba Institute of Technology to Co-Research and Develop Homegrown Physical AI
TOKYO--(BUSINESS WIRE)--Mitsubishi Electric Corporation and Chiba Institute of Technology announced today that they have signed a basic agreement to research and develop homegrown physical AI technologies for public and private sector applications. The two parties will establish a co-creation center and promote the commercialization of AI robotics solutions utilizing a variety of autonomously controlled robots, including multi-legged walking robots, humanoid robots and drone-type robots. The ag...
-
東芝:Arm® Cortex®-M4搭載システム制御向けスタンダードマイコン 「TXZ+™ファミリー エントリークラス M4Hグループ」のエンジニアリングサンプル提供開始について
川崎--(BUSINESS WIRE)--(ビジネスワイヤ) -- 東芝デバイス&ストレージ株式会社は、エアコンや洗濯機などの民生用機器、複合機(MFP: Multifunction Printer)やファクトリーオートメーション(FA)関連機器などの産業用機器における小規模なシステム制御用途のニーズに対応するため、Arm® Cortex®‑M4(FPU機能[注1]搭載)コアを搭載したスタンダードマイコン[注2]「TXZ+™ファミリー エントリークラス M4Hグループ」を開発し、エンジニアリングサンプルの提供を開始しました。 近年、民生/産業用機器の高機能化・多様化が進む中で、システム制御用マイコンには、リアルタイム性や安定性に加え、設計のしやすさ、長期運用を見据えた汎用性、そして派生製品の開発に柔軟に対応できる拡張性が求められています。そこで当社は、汎用性を重視した「TXZ+™ファミリー エントリークラス M4Hグループ」を開発しました。 新製品は、基本機能を厳選したエントリークラスでありながらArm® Cortex®‑M4(FPU機能搭載)コアを採用し、最大120MHzで動作しま...

-
Toshiba Starts Shipping Engineering Samples of TXZ+™ Family Entry‑Class M4H Group, Standard Microcontrollers with Arm® Cortex®‑M4 Core for System Control Applications
KAWASAKI, Japan--(BUSINESS WIRE)--Toshiba introduces entry-level microcontrollers with an Arm® Cortex®‑M4 core for small‑scale system control in consumer and industrial applications....

-
Mobvista (1860.HK) Welcomes Temasek as Major Shareholder
SINGAPORE--(BUSINESS WIRE)--Mobvista (1860.HK), headquartered in Singapore, today announced that Temasek, a Singapore-based global investment company, has established an equity position in the company valued at US$150 million, supporting Mobvista's global expansion. As a global company and leader in AI-powered advertising technology infrastructure, Mobvista has consistently pursued technology-driven growth and sustainable operations. Mobvista's Mintegral platform now sees over 80% of its advert...
-
Larimar se posiciona na SIMA como referência para investimentos imobiliários internacionais
MADRI--(BUSINESS WIRE)--A Larimar City & Resort, cidade inteligente que está sendo desenvolvida na República Dominicana pela empresa espanhola CLERHP, concluiu com sucesso sua participação na SIMA 2026, recebendo uma resposta excepcional do público profissional e reforçando sua posição como um dos projetos imobiliários internacionais mais promissores do mercado. Durante o evento em Madri, a Larimar atraiu a atenção de operadores imobiliários, investidores, redes de vendas e potenciais compr...

-
Faraday Future Founder and Global CEO YT Jia Shares Weekly Investor Update: FF’s Largest-Ever 23-Unit Robot Order Marks Another Step Toward Becoming a Pathbreaker and Driving Force in the Global B2C Robotics Market
LOS ANGELES--(BUSINESS WIRE)--Faraday Future Intelligent Electric Inc. (NASDAQ: FFAI) (“Faraday Future”, “FF” or the “Company”), a California-based global Embodied AI (EAI) ecosystem company, today shared a weekly business update from YT Jia, Founder and Global CEO of FF. “Welcome to Week 56 of our weekly report. First, I’d like to share two business updates, along with a piece of good news on the capital front. The first major update on EAI Devices: FF has entered into a strategic partnership...

-
Odina Industries Set for Growth After Avetta Helps Reduce Contractor Approval Times by Half
SYDNEY--(BUSINESS WIRE)--Avetta®, the leader in intelligent work readiness across global supply chains, today announced the results of its work with construction and infrastructure services company Odina Industries. Avetta supported Odina to drive down its contractor approval times by 50% whilst also dropping its administrative workload by 30%. The collaboration has ensured faster onboarding of suppliers and a renewed focus on high-value tasks and strategic growth for the company. Odina provide...