

Newsroom
Sorted by: Latest
-
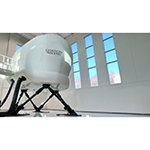
TRU Simulation’s Full Flight Simulator for the Cessna Citation Ascend Achieves FAA Qualification, Expanding Advanced Training for Midsize Jet Pilots
TAMPA, Fla.--(BUSINESS WIRE)--TRU Simulation + Training Inc. announced its Full Flight Simulator for the Cessna Citation Ascend has achieved FAA Level D qualification....
-
Sand Grove Capital Management LLP UK Regulatory Announcement: Form 8.3
LONDON--(BUSINESS WIRE)-- FORM 8.3 PUBLIC OPENING POSITION DISCLOSURE/DEALING DISCLOSURE BY A PERSON WITH INTERESTS IN RELEVANT SECURITIES REPRESENTING 1% OR MORE Rule 8.3 of the Takeover Code (the “Code”) 1. KEY INFORMATION (a) Full name of discloser: Sand Grove Capital Management LLP (b) Owner or controller of interests and short positions disclosed, if different from 1(a): The naming of nominee or vehicle companies is insufficient. For a trust, the trustee(s), settlor and beneficiaries must...
-
SEKO Logistics Achieves World-Class Global Net Promoter Score of +71
SCHAUMBURG, Ill.--(BUSINESS WIRE)--SEKO Logistics achieves world-class global Net Promoter Score (NPS) of +71 for the second half of 2025....

-
Comcast Business Powers February’s Biggest Broadcast Events
PHILADELPHIA--(BUSINESS WIRE)--Comcast Business today announced it is again partnering with NBCUniversal to architect and manage critical components of the linear and digital broadcast for three of television’s marquee events this month – Super Bowl LX, the Milan Cortina 2026 Olympic Winter Games, and the 2026 NBA All-Star Game. With major productions occurring within days of each other, Comcast Business provides the end-to-end connectivity that underpins NBCUniversal’s live coverage across bro...

-
From ‘Quiet Luxury’ to New Neutrals: Westlake Royal Building Products™ Reveals Top 2026 Trends Driving Home Design Choices
HOUSTON--(BUSINESS WIRE)--Westlake Royal Building Products™ (“Westlake Royal”), a Westlake company (NYSE: WLK), announced today the launch of TrendLine™, a data-driven digital experience designed to decode the shifting design preferences of the modern homeowner. The 2026 trend forecast reveals a pivot toward intentional design choices, favoring warm neutrals, natural textures and products that prioritize emotional well-being and structural resilience. “Our data shows that 2026 is the year of th...
-
L3Harris Receives New Contract to Power THAAD Interceptors
MELBOURNE, Fla.--(BUSINESS WIRE)--L3Harris Technologies (NYSE: LHX) has received a new contract valued at nearly $400 million to produce additional solid rocket boost motors and Liquid Divert and Attitude Control Systems (LDACS) as a supplier to the prime contract for the Missile Defense Agency’s Terminal High Altitude Area Defense (THAAD) system. THAAD is one of the nation’s primary defenses against short, medium and intermediate-range missiles. “THAAD is the only U.S. system designed to inter...
-
Deutsche Bank AG UK Regulatory Announcement: Value Per Security
LONDON--(BUSINESS WIRE)-- DB ETC PLC Dated: 16 February 2026 COMPANY ANNOUNCEMENT Immediate Release 16 February 2026 DB ETC plc (the Issuer) (incorporated and registered in Jersey under the Companies (Jersey) Law 1991 (as amended) with registered number 103781) Re: Value per Security of ETC Securities Announcement The Issuer is providing the Value per Security for the ETC Securities for the following Series as set out in the table below for 13 February 2026 Series ISIN Currency Value per Secur...
-
Deutsche Bank AG UK Regulatory Announcement: Buy-Back of Securities
LONDON--(BUSINESS WIRE)-- DB ETC plc COMPANY ANNOUNCEMENT Immediate Release 16 February 2026 Xtrackers Physical Gold ETC (EUR) (Incorporated and registered in Jersey under the Companies (Jersey) Law 1991 (as amended) with registered number 103781) Re: Buy-Back of ETC Securities Announcement The Issuer has agreed to buy back the ETC Securities for the following Series as set out in the table below. Series Number of Securities to be bought back Trade Date Settlement Date ISIN Series 04 - Xtracke...
-
Qube Research & Technologies LTD UK Regulatory Announcement: Form 8.3
LONDON--(BUSINESS WIRE)-- FORM 8.3 PUBLIC OPENING POSITION DISCLOSURE/DEALING DISCLOSURE BY A PERSON WITH INTERESTS IN RELEVANT SECURITIES REPRESENTING 1% OR MORE Rule 8.3 of the Takeover Code (the “Code”) 1. KEY INFORMATION (a) Full name of discloser: Qube Research & Technologies Limited (b) Owner or controller of interests and short positions disclosed, if different from 1(a): The naming of nominee or vehicle companies is insufficient. For a trust, the trustee(s), settlor and beneficiari...